Eni stock forecast: Q2 2026 earnings in focus
Eni is an Italian energy company listed on Borsa Italiana. Its latest session followed the launch of Searah, a 50/50 joint venture with PETRONAS. Explore third-party ENI price targets and technical analysis. Past performance is not a reliable indicator of future results.
Eni S.p.A. (ENI) is trading at €23.86 in early European trading on 8 June 2026, within an intraday range of €23.24–€23.95. Past performance is not a reliable indicator of future results.
The session follows two significant corporate announcements. Eni and PETRONAS officially established Searah on 8 June 2026, a 50/50 joint venture combining assets across Indonesia and Malaysia with an initial production base exceeding 300,000 boe/d and a USD 6 billion revolving credit facility (Eni, 8 June 2026). Eni also signed a Petroleum Exploration Development and Production License Agreement for offshore Block A1 in The Gambia on 5 June 2026, covering 1,300 km² in an Atlantic margin area described as containing proven hydrocarbon discoveries (Eni, 5 June 2026). The company also reported a share buyback of approximately 1.77 million shares for €40.0 million at an average of €22.58 per share as of 3 June 2026, bringing total 2026 repurchases to 6.87 million shares (Stock Titan, 3 June 2026).
Eni: Searah venture frames latest third-party targets
As of 8 June 2026, third-party Eni stock predictions reflect a period of active broker revision following Q1 2026 results and the company's €4 billion buyback approval. The following summaries are drawn exclusively from sources published between 24 May and 8 June 2026 and do not constitute investment advice.
Citi (single-broker target raise)
Citi raised its 12-month price target on the Borsa Italiana-listed shares to €24 from €20.50, maintaining a Neutral rating on the stock. The bank noted Eni's final investment decision on Baleine Phase 3, alongside continued upstream production momentum, as the revision was reported in conjunction with Eni's Baleine Phase 3 approval announcement (Yahoo Finance, 31 May 2026).
The Globe and Mail / TipRanks (consensus snapshot)
The Globe and Mail reported a TipRanks-aggregated analyst consensus of Moderate Buy for ENI S.p.A., with a panel-wide average price target of €25.67. The note accompanied RBC Capital's reiterated Hold following its April 2026 review, with the consensus figure placing the mean target approximately 7.6% above the last price of €23.86 as of 8 June 2026 (The Globe and Mail, 3 June 2026).
MarketBeat (Wall Street consensus, NYSE ADR)
MarketBeat aggregates 13 analyst 12-month price targets for the NYSE-listed ADR (E), arriving at a mean of $42.30, with individual estimates spanning a low of $28 from RBC Capital on 9 April 2026 to a high of $64.30 from Exane BNP Paribas on 17 April 2026. The wide range reflects divergent views on the Brent crude trajectory and Eni's satellite company deconsolidation strategy (MarketBeat, 6 June 2026).
MarketScreener (multi-broker consensus, Milan listing)
MarketScreener aggregates 22 analyst recommendations on the Borsa Italiana-listed shares, reporting a mean 12-month price target of €25.40 and a consensus rating of Outperform, with individual estimates ranging from a low of €19 to a high of €30. The average target implies approximately 6.5% upside from the last price of €23.86 as of 8 June 2026 (MarketScreener, 8 June 2026).
Investing.com (multi-analyst consensus)
Investing.com aggregates projections from 22 analysts covering the Milan-listed shares, returning an average 12-month price target of €25.40, with a low estimate of €19 and a high of €30, amid nine analysts carrying a buy-equivalent recommendation. The aggregated figure aligns closely with the MarketScreener panel, suggesting limited dispersion across major data vendors for this listing (Investing.com, 8 June 2026).
Predictions and third-party forecasts are inherently uncertain, as they cannot fully account for unexpected market developments. Past performance is not a reliable indicator of future results.
Eni S.p.A. (ENI) earnings: latest results and upcoming release
Eni S.p.A. reported its Q1 2026 results on 24 April 2026, with statutory earnings per share of €0.34, approximately 32% below analyst consensus forecasts, while the company confirmed 9% year-on-year upstream production growth and a final investment decision on the Baleine Phase 3 development in Côte d'Ivoire (Eni, 24 April 2026).
Despite the earnings miss, 20 covering analysts revised their full-year 2026 EPS consensus upward to €2.66 in the days following the release, reflecting a projected 163% rebound from the prior-year period (Simply Wall St, 28 April 2026). This followed the company's approval of a €4 billion share buyback programme at its Ordinary Shareholders' Meeting, held on 6 May 2026 in Rome (Eni, 6 May 2026).
Eni's next scheduled earnings release is its Q2 2026 results, currently estimated for Friday, 24 July 2026, covering the three months to 30 June 2026. The Q2 report will be the first full-quarter result to capture the financial contribution from the Searah joint venture, officially established with PETRONAS on 8 June 2026, as well as the ongoing impact of the expanded buyback and the Baleine Phase 3 sanction on capital expenditure guidance (Eni, 8 June 2026).
Past performance should never be relied upon as a definitive indicator of future trends. Earnings estimates are third-party projections and are subject to revision; actual results may differ materially.
ENI stock price: technical overview
The ENI stock price trades at €23.86 as of 10:43 UTC on 8 June 2026, above its short-term moving average cluster. The 20-, 50-, 100- and 200-day SMAs are positioned at approximately €23.36, €23.45, €21.32 and €18.45, respectively, while the 20-over-50 alignment remains intact across both the simple and exponential moving average families, according to TradingView data. The Hull moving average (9) at €23.79 is close to the last price, while the 100- and 200-day SMAs remain well below it.
The 14-day RSI registers at 57.60, an upper-neutral reading that carries no extreme signal in either direction. The average directional index (14) stands at 10.20, below the conventional 15 threshold, suggesting trend strength is currently weak and the recent move lacks strong directional conviction, according to TradingView oscillator data.
On the topside, the classic R1 pivot at €23.84 sits close to the last price. A sustained daily close above that level would put the R2 pivot at €25.15 in view. To the downside, the classic pivot point at €23.03 represents initial reference support, with the S1 pivot at €21.72 the next level should the pivot give way. The 100-day SMA at €21.32 provides a broader moving average reference in that area (TradingView, 8 June 2026).
This is technical analysis for informational purposes only and does not constitute financial advice or a recommendation to buy or sell any instrument.
Eni share price history (2024–2026)
ENI’s stock price opened June 2024 trading near €14.13 and stayed broadly rangebound through the rest of that year, moving between roughly €13.57 and €14.82 as oil markets digested shifting OPEC+ output policy and macroeconomic uncertainty. It closed 2024 at €13.10, before nudging up to €13.50 by 2 January 2025.
The stock drifted in a tight €13.40–€14.50 band through the first quarter of 2025, then fell sharply in April as broader risk-off sentiment – coinciding with the peak of US tariff escalation – dragged ENI to a two-year low of €11.28 on 9 April 2025. A partial recovery followed, with the stock moving back towards €13.50 by June 2025.
From there, ENI traded sideways through the summer and autumn of 2025, broadly anchored between €14 and €15.40, before slipping back below €16 heading into year-end. The more pronounced re-rating came in 2026: the stock broke above €16 in early January, gathered pace through February and March amid rising Brent prices and Eni’s capital markets update, and accelerated into April, reaching €25.06 on 7 April 2026.
ENI closed at €23.87 on 8 June 2026, approximately 51.6% higher year to date and 61.7% higher year on year.
Past performance is not a reliable indicator of future results. Share prices are indicative and may differ from live market prices.
Eni (ENI): Capital.com analyst view
ENI’s sharp re-rating in 2026 – up approximately 51.6% year to date as of 8 June 2026 – reflects a combination of company-specific and macro drivers. Elevated Brent crude prices, amplified by Middle East supply disruption, have contributed to a 20% upward revision to Eni’s full-year 2026 adjusted cash flow guidance to €13.8bn. A 90% expansion of the share buyback programme to €2.8bn and 9% upstream production growth in Q1 have also supported investor confidence in the company’s capital returns framework. The establishment of the Searah joint venture with PETRONAS on 8 June 2026 has further broadened the upstream growth narrative.
However, ENI’s earnings remain materially exposed to Brent price moves. A reversal in oil prices – whether from demand weakness, OPEC+ supply increases or broader macro deterioration – could weigh on cash flow, while Q1 2026 statutory EPS already missed consensus estimates by approximately 32%.
The energy transition also presents a dual dynamic for ENI. The company’s diversified model, spanning biofuels, LNG and satellite deconsolidation, may offer partial insulation from fossil fuel demand risk, but it also introduces execution complexity and capital allocation uncertainty that some investors may view cautiously. Volatility in European energy policy and currency moves between the euro and the US dollar add further layers of risk to the near-term earnings outlook.
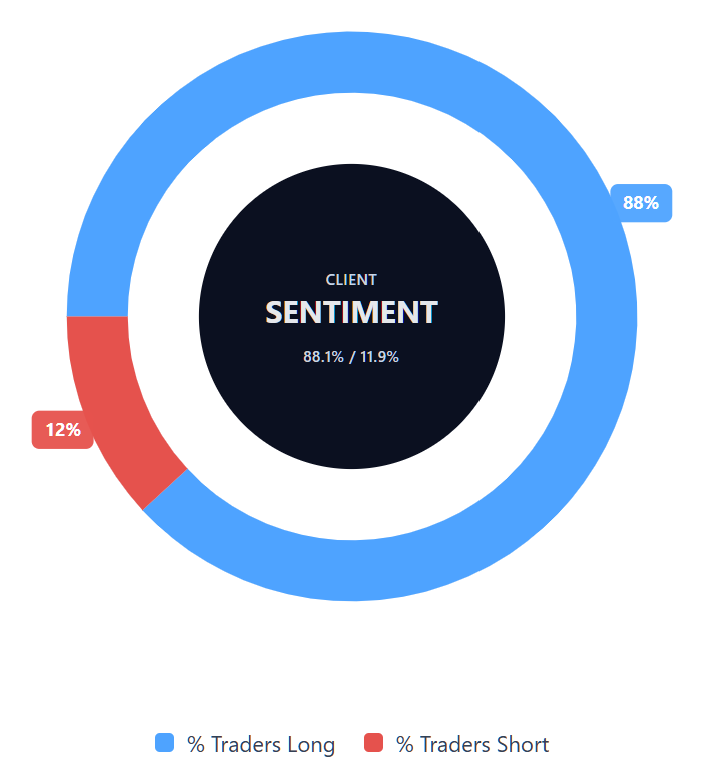
Capital.com’s client sentiment for Eni CFDs
As of 8 June 2026, Capital.com client positioning in Eni CFDs shows 88.1% buyers versus 11.9% sellers, putting buyers ahead by 76.2 percentage points. This places sentiment in one-sided territory. The snapshot reflects open positions on Capital.com at the time of writing and is subject to change.
Summary – Eni 2026
- ENI trades at €23.86 as of 10:43 UTC on 8 June 2026, up approximately 51.6% year to date and 61.7% year on year.
- Key price drivers include elevated Brent crude prices, a 90% expansion of the 2026 share buyback programme to €2.8bn, and 9% Q1 upstream production growth.
- Eni and PETRONAS officially established the Searah joint venture on 8 June 2026, combining South-East Asian assets with initial production exceeding 300,000 boe/d.
- Eni was awarded exploration Block A1 in The Gambia on 5 June 2026, covering 1,300 km² of Atlantic margin acreage with proven hydrocarbon discoveries.
- Key risks include Brent price volatility, Q1 2026 EPS missing consensus by approximately 32%, and execution complexity from Eni’s energy transition diversification strategy.
Past performance is not a reliable indicator of future results.
FAQ
Who owns the most Eni S.p.A. stock?
Eni S.p.A.’s shareholder base includes a mix of state-linked and institutional investors, alongside free-float shares held by the wider market. As a strategically important Italian energy company, Eni has historically had significant public-sector ownership, while institutional holdings can vary over time as funds adjust exposure. Traders should check the company’s latest shareholder disclosures for the most current ownership breakdown, as reported positions can change after filings.
What is the five-year Eni S.p.A. share price forecast?
Five-year ENI stock forecasts depend on assumptions around Brent crude prices, production growth, capital returns, energy transition spending, and broader macroeconomic conditions. The article focuses on third-party 12-month analyst targets, which cluster around €25.40–€25.67 for the Milan-listed shares, with individual estimates spanning €19–€30. Longer-term forecasts are more uncertain, as they rely on variables that can change materially over time.
Is Eni S.p.A. a good stock to buy?
Whether Eni S.p.A. is a good stock to buy depends on individual objectives, risk tolerance, time horizon, and portfolio exposure. The company has benefited from higher Brent crude prices, upstream production growth, and an expanded buyback programme, but its earnings remain exposed to oil-price volatility, policy risk, currency moves, and energy transition execution. This information is not investment advice, and traders should carry out their own research before making decisions.
Could Eni S.p.A. stock go up or down?
Eni S.p.A. stock could move in either direction. Factors that could support the share price include stronger oil prices, higher production, continued buybacks, or progress on projects such as Baleine Phase 3 and the Searah joint venture. Downside risks include weaker energy demand, OPEC+ supply changes, lower Brent prices, earnings misses, or delays in strategic projects. Forecasts and technical signals can be useful reference points, but they’re frequently inaccurate.
Should I invest in Eni S.p.A. stock?
The decision to invest in Eni S.p.A. stock should be based on your own financial circumstances, goals, risk appetite, and understanding of the market. Eni offers exposure to the energy sector, including oil, gas, LNG and lower-carbon initiatives, but that also brings commodity-price sensitivity and execution risk. Past performance is not a reliable indicator of future results. This article is for informational purposes only and doesn’t recommend buying or selling Eni shares.
Can I trade Eni S.p.A. CFDs on Capital.com?
Yes, you can trade Eni CFDs on Capital.com. Trading share CFDs lets you speculate on price movements without owning the underlying asset and to take long or short positions. However, contracts for difference (CFDs) are traded on margin, and leverage amplifies both profits and losses. You should ensure you understand how CFD trading works, assess your risk tolerance, and recognise that losses can occur quickly.