
Shell share price: renewables sale to TotalEnergies
Shell agreed on 3 August 2026 to sell around 500 megawatts of European onshore renewables assets to TotalEnergies as part of its portfolio changes. Explore third-party SHEL price targets and technical analysis. Past performance is not a reliable indicator of future results.
Shell Plc (SHEL) was trading at £32.66 as of 10:36am UTC on 10 August 2026, within an intraday range of £32.555–£33.20. Past performance is not a reliable indicator of future results.
The session followed Shell's agreement, announced on 3 August 2026, to sell its European onshore renewables portfolio to TotalEnergies (Reuters, 3 August 2026). The portfolio comprises around 500 megawatts of operating and under-construction solar and wind assets, and the sale forms part of Shell's wider capital reallocation towards upstream oil and gas operations (Shell plc, 3 August 2026).
Trading also came amid continued volatility in Brent crude (TradingEconomics, 9 August 2026). Oil prices fell sharply in early August after reports of a de-escalation understanding affecting shipping through the Strait of Hormuz, before stabilising near $84 a barrel by 10 August (CNBC, 6 August 2026).
Shell's second-quarter 2026 results provided further company-specific context (Shell plc, 30 July 2026). Released on 31 July, they showed adjusted earnings of $9.8 billion alongside a further $3 billion share buyback programme (CNBC, 30 July 2026). The company cited higher energy prices and stronger LNG trading as supporting factors, while lower volumes reflected disruption at its Qatar operations (Investing.com, 30 July 2026).
Third-party Shell outlook: renewables sale
As of 10 August 2026, third-party Shell share price predictions show a broad range of 12-month Shell price targets. The targets below refer to the London-listed ordinary shares and are stated in sterling where reported.
UBS (broker update)
UBS maintains a Neutral rating on Shell and reiterated its stance. The rating reflects a valuation view rather than a certain forecast of future performance (MarketScreener, 31 July 2026).
Investing.com (consensus estimate)
Investing.com's 5 August 2026 consensus data puts Shell's average 12-month target at £37.34, based on 15 analysts, with estimates ranging from £30.56 to £45.05. The aggregation includes RBC Capital Markets' £40 Hold target, issued on 15 July 2026, and reflects differing assumptions about energy prices, cash generation and valuation (Investing.com, 5 August 2026).
MarketBeat (London consensus)
MarketBeat reports a Moderate Buy consensus rating and an average 12-month target of £37.75 for Shell as of 9 August 2026, drawn from 12 tracked analysts. Its reported range runs from £27 to £45, and the average target represents a forecast upside of 15.18% from the price at the time of capture (MarketBeat, 9 August 2026).
RBC Capital Markets (new coverage)
RBC Capital Markets initiated coverage with a Hold rating and a £40 target for Shell on 15 July 2026. The target sat above the contemporaneous share price, while the Hold rating indicated a neutral view of the balance between valuation and expected returns (The Globe and Mail, 31 July 2026).
Jefferies (rating reaffirmation)
Jefferies reiterated its Buy rating and maintained a £45 price objective for Shell on 31 July 2026. The target followed the company's second-quarter reporting, with Jefferies reaffirming its existing view rather than issuing a new forecast, implying a stated upside of 33.35% from the prior close (MarketBeat, 31 July 2026).
Predictions and third-party forecasts are inherently uncertain, as they cannot fully account for unexpected market developments. Past performance is not a reliable indicator of future results.
Shell latest and upcoming earnings
Shell reported second-quarter 2026 results on 30 July 2026 at 07:00 BST, according to the company's official press release (Shell plc, 30 July 2026). Adjusted earnings reached $9.8 billion, up from $4.3 billion in the prior-year period, while cash flow from operations exceeded $21 billion despite what Shell described as ongoing disruptions in the Middle East (Reuters, 30 July 2026).
Alongside the results, Shell announced a second-quarter interim dividend and confirmed a further $3.0 billion share buyback programme (Shell plc, 30 July 2026). This comprises new buybacks alongside $1.2 billion carried over from amounts not undertaken in a previous period (Shell, 30 July 2026). The programme is in line with Shell's stated policy of returning 40 to 50% of cash flow from operations through the cycle (CNBC, 30 July 2026).
The ex-dividend date for ordinary shares is set for 13 August 2026, followed by the record date on 14 August and payment on 21 September (Shell plc, 8 August 2026). Sterling and euro dividend equivalents are due to be announced on 7 September 2026 (Shell plc, 8 August 2026).
Shell's financial calendar lists third-quarter 2026 results and the corresponding interim dividend announcement for 29 October 2026 (Shell plc, 30 July 2026). As of 10 August 2026, the company had not disclosed any change to that date (Shell plc, 8 August 2026).
SHEL share price: technical overview
The SHEL share price was trading at £32.66 at 10:36am UTC on 10 August 2026, just below its 20-day moving average near £32.75 and above its 50-, 100- and 200-day moving averages. According to TradingView data, these stood at approximately £31.44, £32.29 and £30.37, respectively, while the 20-day average remained above the 50-day average.
The 14-day relative strength index (RSI) was near 53, a reading generally regarded as neutral, while the 14-day average directional index (ADX) was around 36.9. On TradingView's measure, the ADX reading indicates a more established trend but does not show its direction.
TradingView's classic pivot data placed the nearest level above the last price at around £35.75, followed by another pivot near £37.67. Below the last price, the classic pivot point stood near £32.18, close to the 100-day moving average at around £32.29. A further reference area lay at £30.27–£30.37, where the first support level was close to the 200-day moving average (TradingView, 10 August 2026).
This is technical analysis for informational purposes only and does not constitute financial advice or a recommendation to buy or sell any instrument.
Shell share price history (2024–2026)
SHEL’s share price traded around £28.06 in mid-August 2024, before recording periods of both gains and declines.
Early 2025 brought a sharp decline, with the stock reaching a two-year low of £22.73 on 9 April as markets responded to the Trump administration's ‘Liberation Day’ tariff announcements. Shares then recovered through the rest of the year and closed 2025 at £27.39.
In 2026, Shell rose to a two-year high of £35.97 on 7 April before declining in the following session amid wider market volatility. Price movements became more variable during the summer, with the shares falling to £29.04 by the end of June before rising again into August.
Shell closed at £32.69 on 10 August 2026 – around 16.5% higher over the two-year period, 19.3% higher year to date and 23.2% higher year on year. These figures describe historical price performance and do not indicate future returns.

Past performance is not a reliable indicator of future results. Share prices are indicative and may differ from live market prices.
Shell (SHEL): Capital.com analyst view
Shell's share price rose through much of 2026, moving from around £27 at the start of the year to around £32.66 by 10 August. Several company and market factors formed part of the backdrop over this period, including movements in oil and gas prices, cash generation and Shell's ongoing share buyback programme.
Shell's position as a diversified integrated energy company also gives it exposure to LNG trading, which contributed to recent quarterly results. That exposure can affect performance in either direction: changes in oil and gas prices, trading conditions or supply can influence revenue and earnings. Geopolitical developments affecting energy supply routes, including shipping through the Strait of Hormuz, can add another source of uncertainty.
Shell's capital allocation also remains relevant. Its buyback programme and portfolio adjustments, including the recent renewables disposal, form part of its approach to shareholder distributions and investment. However, future buybacks depend on factors including cash generation and capital requirements, so their size and pace can change.
Wider macroeconomic and regulatory factors, including energy-transition policy and currency movements, add further uncertainty to the outlook. Past performance is not a reliable indicator of future results, and this content does not constitute financial advice.
Capital.com’s client sentiment for Shell CFDs
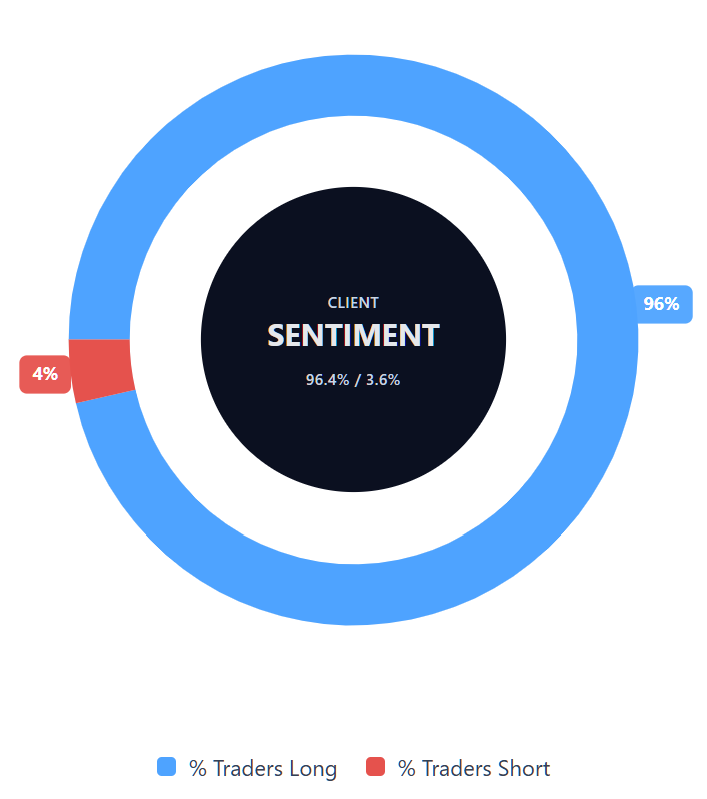
As of 10 August 2026, Capital.com client positioning in Shell CFDs was weighted towards long positions at the time of the snapshot, with 96.4% long versus 3.6% short.
Client sentiment shows how Capital.com traders are positioned at a particular point in time. It does not indicate how the market will move, and positioning can change
Summary – Shell 2026
- As of 10:36am UTC on 10 August 2026, Shell traded near £32.66, around 16.5% higher over two years and 19.3% higher year to date.
- Technical indicators placed the price near its 20-day moving average, with an RSI near 53 and an ADX reading suggesting a more established trend without indicating its direction.
- Relevant company and market factors include Brent crude volatility, Shell's LNG trading performance, ongoing share buybacks and portfolio changes such as the recent renewables disposal.
- Recent company updates include Shell's second-quarter results, a further $3 billion buyback programme and an interim dividend with an ex-dividend date of 13 August 2026.
Past performance is not a reliable indicator of future results.
FAQ
Who owns the most Shell shares?
The article does not identify Shell’s largest individual or institutional shareholder, so it would be misleading to name one here without separate ownership data. Shell is a publicly listed company with shares held by a range of institutional and individual investors. Ownership levels can also change over time as investors buy or sell shares. For the latest breakdown, traders should refer to Shell’s shareholder disclosures or current regulatory filings.
What is the five-year Shell share price forecast?
The article does not provide a five-year Shell share price forecast. The third-party estimates covered are 12-month analyst targets, ranging from £27 to £45.05, with reported consensus averages of £37.34 and £37.75. These figures reflect different assumptions about commodity prices, cash generation, operations and shareholder distributions. Longer-term forecasts would involve greater uncertainty, and analyst targets should not be treated as reliable predictions of future performance.
Is Shell a good stock to buy?
Whether Shell is a suitable stock to buy depends on an individual’s objectives, risk tolerance and wider portfolio, so the article does not make a recommendation. Recent factors include strong cash generation, LNG trading performance, share buybacks and portfolio changes, alongside risks from oil and gas price movements, geopolitical developments, regulation and currency fluctuations. Third-party analyst views also differ, underlining that there is no single agreed outlook for the shares.
Could Shell shares go up or down?
Yes. Shell shares can move in either direction as market conditions and company-specific factors change. The article highlights influences including Brent crude prices, LNG trading performance, cash generation, buybacks, portfolio decisions and geopolitical developments affecting energy supply. Technical indicators can provide reference points, but they do not predict future prices. Wider economic conditions, regulation and currency movements may also affect Shell’s share price over time.
Should I invest in Shell shares?
The article does not recommend whether anyone should invest in Shell shares. Shell’s recent performance reflects a combination of company results, energy prices, capital allocation and broader market conditions, while future performance remains uncertain. Investors may consider factors such as earnings, cash flow, commodity exposure, dividend policy and geopolitical risk, but these can change. Past performance is not a reliable indicator of future results, and individual circumstances will differ.
Can I trade Shell CFDs on Capital.com?
Yes, you can trade Shell CFDs on Capital.com. Trading share CFDs lets you speculate on price movements without owning the underlying asset and to take long or short positions. However, contracts for difference (CFDs) are traded on margin, and leverage amplifies both profits and losses. You should ensure you understand how CFD trading works, assess your risk tolerance, and recognise that losses can occur quickly.