
BP share price: Calypso deal and oil prices
BP reported second-quarter underlying replacement-cost profit of $5.73bn and agreed to acquire Woodside’s 70% stake in the Calypso gas project in August 2026. Explore third-party BP. price targets and technical analysis. Past performance is not a reliable indicator of future results.
BP plc. (BP.) is trading at £5.25 at 2:35pm UTC on 10 August 2026, at the top of an intraday range of £5.13–£5.25. Past performance is not a reliable indicator of future results.
BP (BP.) is trading at £5.25 in London afternoon trading on 10 August 2026, at the top of an intraday range of £5.13–£5.25 recorded as of 2:35pm UTC. The stock has firmed since its second-quarter results were published on 4 August 2026, when underlying replacement-cost profit reached $5.73 billion, up from $3.2 billion in the prior quarter (Reuters, 4 August 2026).
BP's share price rose following its second-quarter results, in which underlying replacement-cost profit more than doubled to $5.73bn as higher trading and refining margins offset lower upstream production (Reuters, 4 August 2026). Other developments also shaped the market backdrop. BP agreed to acquire Woodside's 70% stake in the Calypso gas project on 7 August 2026, a transaction that gives BP full ownership of the early-stage deepwater discovery in Trinidad and Tobago (Reuters, 6 August 2026). Brent crude traded near $84 a barrel amid ongoing US-Iran discussions over shipping access through the Strait of Hormuz (Trading Economics, 10 August 2026).
Third-party BP outlook: Q2 profit surge, oil prices
As of 10 August 2026, third-party BP share price predictions refer to BP's US-listed ADR, except where stated otherwise. They project potential 12-month prices and represent analysts' views rather than guarantees of future performance.
Piper Sandler (maintained target)
Piper Sandler maintains a Hold rating and a $43 12-month target for BP's US-listed ADR, captured on 7 August 2026. The target was raised from $42, with the rating unchanged (Moomoo, 7 August 2026).
Benzinga (consensus overview)
Benzinga reports a $43.51 consensus target for BP's US-listed ADR, based on 23 analyst ratings captured on 28 July 2026. Its consensus compilation incorporates the latest available ratings and target prices from the covered analysts (Benzinga, 28 July 2026).
Public.com (consensus overview)
Public.com reports a $46.85 target for BP's US-listed ADR, based on 11 analyst ratings captured on 9 August 2026. The associated consensus rating is Hold, with individual ratings spanning Strong Buy to Strong Sell (Public.com, 9 August 2026).
Wells Fargo (trimmed target)
Wells Fargo maintains a Hold rating and sets a $48 target for BP's US-listed ADR, captured on 6 August 2026. The target was reduced from $54 while the rating was retained (The Globe and Mail, 6 August 2026).
Mizuho (revised target)
Mizuho sets a $53 target for BP's US-listed ADR, captured on 5 August 2026. The target is listed alongside Mizuho's current analyst assessment for the ADR (Moomoo, 5 August 2026).
Predictions and third-party forecasts are inherently uncertain, as they cannot fully account for unexpected market developments. Past performance is not a reliable indicator of future results.
BP earnings: latest results and next report
BP published its second-quarter 2026 results on 4 August 2026, reporting underlying replacement cost profit of $5.7bn, up $2.5bn from the prior quarter, according to the company's official stock exchange announcement. The company said the increase reflected higher price realisations, stronger trading performance and lower operating costs. Operating cash flow reached $10.9bn for the quarter. BP also disclosed net debt of $22.3bn at quarter-end and confirmed a dividend of $0.52 per ADS, with an ex-dividend date of 14 August 2026 (BP, 4 August 2026).
The results followed a period of elevated oil prices. BP noted that geopolitical developments affecting global supply influenced market conditions during the quarter, although it did not attribute a specific financial figure to this factor (BP, 4 August 2026). Reuters separately reported that BP's profit had more than doubled year on year to $5.73bn, exceeding the average analyst estimate it cited (Reuters, 4 August 2026). It linked the increase to higher energy prices, trading income and refining margins during the quarter (Reuters, 4 August 2026).
BP's next scheduled results release is its third-quarter 2026 report, indicatively dated 3 November 2026, according to the company's financial calendar. BP notes that all forward-looking dates on the calendar are indicative and subject to change (Investing.com, 10 August 2026).
BP. share price: technical overview
TradingView data as of 2:35pm UTC on 10 August 2026 shows the BP. share price trading within a cluster of key moving averages on the daily chart. The 20/50/100/200-day simple moving averages (SMAs) stand at 530p (£5.30), 513p (£5.13), 538p (£5.38) and 498p (£4.98), respectively. The 100-day exponential moving average (EMA) sits lower, near 518p (£5.18), while the 20-day SMA remains above the 50-day SMA. Taken together, these indicators present a mixed moving-average picture rather than a single directional signal.
Momentum indicators also provide a relatively balanced reading. The 14-day relative strength index (RSI) sits near 51.2, providing no strong directional bias on its own. The average directional index (ADX) reads 26.9, above the 25 level TradingView uses to identify an established trend. ADX measures trend strength rather than direction, so the reading does not indicate whether prices may rise or fall.
Several calculated levels provide further technical reference points. Above the current price, TradingView's nearest classic pivot resistance level, R1, stands near 589p (£5.89), followed by R2 near 626p (£6.26). Below it, the classic pivot point sits near 520p (£5.20), with the 200-day SMA near 498p (£4.98) and the S1 pivot near 483p (£4.83). These figures are calculated technical levels rather than guarantees of future price direction (TradingView, 10 August 2026).
This is technical analysis for informational purposes only and does not constitute financial advice or a recommendation to buy or sell any instrument.
BP share price history (2024–2026)
BP.’s share price has moved across a wide range over the past two years, from below £3.30 to above £6, against a backdrop of changing oil prices, trade policy developments and conflict in the Middle East.
The stock started August 2024 near £4.42 before declining through the winter to close the year at £3.93. Early 2025 brought a recovery with periods of volatility, but prices fell sharply in April. Donald Trump’s ‘Liberation Day’ tariffs coincided with a decline in Brent crude, while BP reached a two-year low of £3.30 on 11 April 2025.
BP then rose through the second half of 2025 and ended the year at £4.33. Price movements became more pronounced in early 2026 as geopolitical developments affected energy markets. Escalating conflict involving Iran and disruption to Middle East supply routes coincided with a rise in Brent crude, while BP reached a 16-year intraday high of £6.10 on 31 March 2026.
Shares subsequently declined through the spring and summer. BP's second-quarter results, published on 4 August 2026, then showed profit more than doubling year on year, alongside higher energy prices, trading income and refining margins reported during the quarter.
BP closed at £5.25 on 10 August 2026.

Past performance is not a reliable indicator of future results. Share prices are indicative and may differ from live market prices.
BP (BP.): Capital.com analyst view
BP's share price rose during 2026, extending a move higher that began in early spring. The move coincided with higher oil prices linked to Middle East supply disruption, as well as quarterly earnings that exceeded the average analyst estimate cited by Reuters. Trading and refining margins also partly offset softer upstream production volumes.
The outlook remains sensitive to several variables. Geopolitical developments may continue to affect oil prices and shipping routes, while any easing of tensions or normalisation of key transport routes could weigh on crude prices and affect BP's earnings. Conversely, renewed disruption could contribute to further volatility in energy markets.
BP's portfolio changes add another factor to consider. The company has been adjusting its asset base through measures including North Sea disposals and its Woodside transaction. These moves may affect BP's balance sheet and its exposure to the future performance of the assets involved, although their longer-term effect remains uncertain. Currency movements, interest-rate expectations and broader economic conditions may also influence sentiment towards BP and other energy shares.
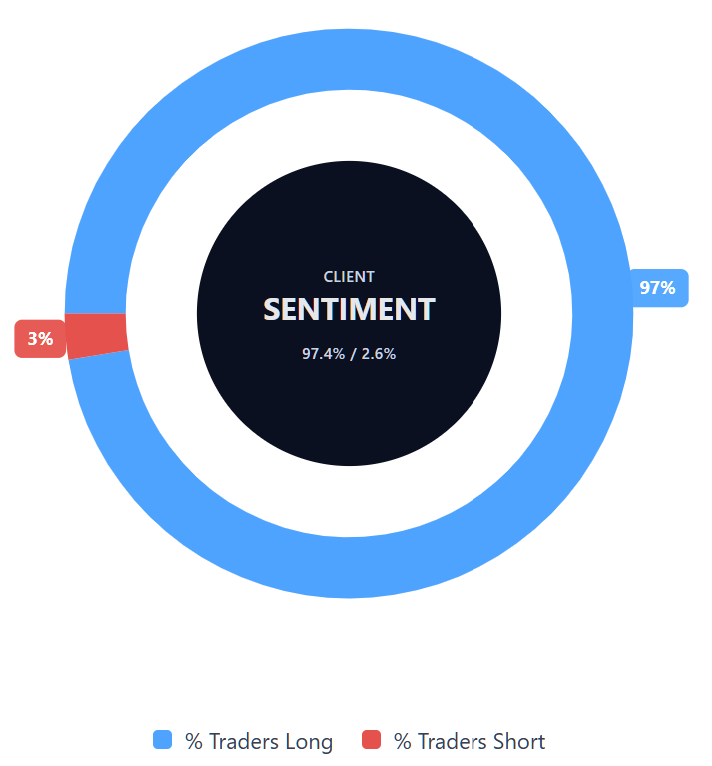
Capital.com’s client sentiment for BP CFDs
As of 10 August 2026, Capital.com client positioning in BP CFDs shows 97.4% buyers versus 2.6% sellers, a difference of 94.8 percentage points. This represents the positioning of Capital.com clients rather than the wider market and does not indicate future price direction. The snapshot reflects open positions as of 10 August 2026 and can change.
Summary – BP 2026
- As of 2.35pm UTC on 10 August 2026, BP was trading near £5.25, above its two-year low of £3.30 in April 2025 and below its March 2026 16-year high of £6.10.
- According to TradingView data, BP was trading within its moving-average cluster. RSI stood near 51.2, while ADX was near 26.9, suggesting neutral momentum alongside an established trend-strength reading, without indicating its direction.
- Factors that may influence BP's price include Brent crude prices, geopolitical developments in the Middle East, trading and refining margins, upstream production and BP's ongoing portfolio changes.
Past performance is not a reliable indicator of future results.
FAQ
Who owns the most BP shares?
The article does not identify BP’s largest individual or institutional shareholders. Ownership can also change over time as investors adjust their holdings. For readers assessing BP, shareholder structure may provide useful context, but it does not determine future price performance. Other factors covered in this article, including oil prices, geopolitical developments, company earnings, trading and refining margins, and BP’s portfolio changes, may also influence how the shares perform.
What is the five-year BP share price forecast?
The article does not provide a five-year BP share price forecast. The third-party estimates covered here relate mainly to 12-month targets for BP’s US-listed ADR, ranging from $43–$53, with consensus figures of $43.51 and $46.85. Forecasts become increasingly uncertain over longer periods because BP’s price may respond to changes in oil markets, earnings, geopolitics, interest rates, currencies and the company’s strategy. Analyst targets are estimates, not guarantees.
Is BP a good stock to buy?
Whether BP is suitable to buy depends on an individual’s objectives, risk tolerance and circumstances, so there is no single answer. The article highlights both supportive and adverse factors. Recent earnings benefited from higher energy prices, trading income and refining margins, while geopolitical developments and portfolio changes remain important variables. Oil prices may also move in either direction. Third-party analyst targets provide additional context, but they should not be treated as recommendations or guarantees of future performance.
Could BP shares go up or down?
Yes. BP shares can move in either direction, and the article identifies several factors that may contribute to future price changes. These include Brent crude prices, geopolitical developments in the Middle East, upstream production, trading and refining margins, currency movements, interest-rate expectations and BP’s portfolio decisions. Technical indicators may offer additional reference points, but they cannot predict future prices. Changes in any of these factors could contribute to gains, losses or periods of volatility.
Should I invest in BP shares?
This article cannot determine whether investing in BP shares is appropriate for you. That decision depends on factors such as your financial circumstances, objectives, investment horizon and willingness to accept losses. The information here is intended to provide context on BP’s recent performance, earnings, analyst forecasts, technical indicators and potential price drivers. None of these factors can establish what the shares will do next, and past performance is not a reliable indicator of future results.
Can I trade BP CFDs on Capital.com?
Yes, you can trade BP CFDs on Capital.com. Trading share CFDs lets you speculate on price movements without owning the underlying asset and to take long or short positions. However, contracts for difference (CFDs) are traded on margin, and leverage amplifies both profits and losses. You should ensure you understand how CFD trading works, assess your risk tolerance, and recognise that losses can occur quickly.