
IAG share price forecast: flying high or waiting in the wings?
IAG, the airline group behind British Airways, completed a €500m share buyback in September 2026, while BA announced plans to increase Latin American seat capacity by 25% for summer 2027. Explore third-party IAG price targets. Past performance is not a reliable indicator of future results.
International Consolidated Airlines Group SA (IAG) traded at 429.65p at 8:55am UTC on Tuesday 22 September, within a 422.75p–430.95p intraday range and close to the session high. Past performance is not a reliable indicator of future results.
IAG completed a €500m share buyback programme on 10 September, repurchasing 97,747,488 shares, or about 2.12% of issued share capital (Investing.com, 11 September 2026). A week later, British Airways said it plans to increase Latin American seat capacity by 25% for summer 2027, including a daily London Heathrow–Buenos Aires service (Reuters, 17 September 2026).
Reuters reported that higher prices linked to the Iran conflict have added pressure ahead of the northern-hemisphere winter season (Reuters, 14 September 2026). Higher fuel costs can squeeze margins if airlines cannot offset them through fares or savings, while lower prices can ease that pressure.
IAG stock forecast 2026–2030: third-party price targets
As of 22 September 2026, third-party International Consolidated Airlines stock predictions vary widely, reflecting diverging views on where the stock’s price could move next.
RBC Capital Markets (broker price target)
RBC reiterates an Outperform rating and a 500p 12-month target, unchanged from its previous update. That compares with a closing price of 409.70p on 14 September 2026. The bank cites tight long-haul capacity and a margin profile it believes the market has not fully reflected in IAG's valuation (Ad Hoc News, 16 September 2026).
Investors Chronicle (median consensus target)
Investors Chronicle reports a median 12-month target of 548.69p from 13 analysts, with estimates ranging from 402.95p to 643p. The median sits about 31% above the 419.30p reference price used in the update, while the wider range shows how individual broker assumptions differ (Investors Chronicle, 17 September 2026).
Investing.com (broker aggregate target)
Investing.com's poll of 15 analysts gives IAG an average 12-month target of 545.05p, within a 401.34p–645.37p range. Thirteen analysts rated the stock 'Buy'. The average combines different assumptions around demand, costs and earnings (Investing.com, 18 September 2026).
MarketScreener (consensus estimate)
MarketScreener reports a mean 12-month target of €6.36 per share from 15 analysts, with a mean consensus rating of 'Buy'. Its average target sits roughly 27% above the last closing price used by the platform (MarketScreener, 21 September 2026).
Simply Wall St (fair value model)
Simply Wall St estimates IAG's fair value at 543p per share. Its discounted cash flow model incorporates assumptions around future cash flows, fleet modernisation and the group's operations across British Airways, Iberia, Vueling and Aer Lingus (Simply Wall St, 21 September 2026).
Predictions and third-party forecasts are inherently uncertain, as they cannot fully account for unexpected market developments. Past performance is not a reliable indicator of future results.
IAG earnings: latest results and next update
IAG reported revenue of €16.064bn for the six months to 30 June 2026, up 1% from €15.906bn a year earlier.
Passenger revenue rose 2.3% to €14.082bn, while cargo revenue fell 9.4% to €570m and other revenue declined 6.2% to €1.412bn. Group capacity fell 0.1% compared with H1 2025, while passenger unit revenue (PRASK) increased 2.4%, or 6.2% at constant currency.
IAG reiterated full-year 2026 fuel-cost guidance of about €9.0bn, based on the jet-fuel forward curve and FX rates at 5 May 2026. It said it remained on track to complete the remaining €1bn of excess cash returns by the end of February 2027.
Net leverage stood at 0.5× at the end of Q1 2026, with liquidity of €12.7bn. The next scheduled update is the Q3 2026 trading statement on 6 November 2026 (IAG, 31 July 2026).
IAG stock price: technical overview
As of at 8:55am UTC on 22 September 2026, the IAG stock price trades at 429.65p, between the classic pivot at 435p and first support at 420p.
The 20-, 50-, 100- and 200-day simple moving averages (SMAs) sit at roughly 425p, 433p, 432p and 416p. With the 20-day SMA below the 50-day, the short-term picture is mixed.
The 14-day RSI stands at 55.6, while ADX reads 23.6, below the 25 level often associated with a stronger trend. MACD is slightly negative at -2.7, while 10-day momentum is +10.4. The stochastic at 82.7 and Williams %R at -2.7 sit in overbought territory, suggesting strong recent buying activity without necessarily signalling a reversal.
From here, 435p acts as the nearest technical reference above the market, followed by 454p and 469p. Below 420p, the next levels sit around the 200-day SMA at 416p and then 401p (TradingView, 22 September 2026).
Technical analysis is for informational purposes only and does not constitute financial advice or a recommendation to buy or sell any instrument.
IAG share price history (2024–2026)
IAG’s stock price traded near 200p in late September 2024 before rising above 300p by December. It reached about 365p in February 2025, then fell to around 260p in April.
A rebound took the shares to roughly 390p in early June, followed by a fall to about 305p later that month. They then climbed to around 490p by 15 July before dropping towards 360p by the end of August amid higher jet-fuel costs and Middle East tensions.
Through late 2025, IAG traded mainly within a 390p–430p range. In early 2026, the shares briefly reached about 466p, fell to around 333p in March and recovered towards 490p by early July.
More recently, the price moved from around 405p to about 436p during September, a period that included IAG's buyback completion and British Airways' Latin American capacity announcement

Past performance is not a reliable indicator of future results. Share prices are indicative and may differ from live market prices.
International Consolidated Airlines (IAG): Capital.com analyst view
IAG's CFD price stood at 429.65p at 8:55am UTC on 22 September 2026, below the July intraday high of 490.30p but well above the levels seen in 2024.
The outlook could depend on several factors:
Passenger demand
Resilient passenger demand could support revenue and yields, while weaker demand or pressure on fares could weigh on both. With capacity expected to remain broadly flat, changes in pricing and load factors may play an important role in revenue performance.
Fuel prices
IAG indicated full-year fuel-cost scenarios of €8.3bn–€8.6bn and said it expected to recover about 60% of higher fuel costs through revenue and cost measures. Lower jet-fuel prices could ease pressure on margins, while sustained increases could have the opposite effect, particularly if IAG cannot offset them through fares, hedging or savings. Reuters reported on 21 September that Europe faced a potential fourth-quarter jet-fuel supply deficit.
Global expansion
British Airways' planned increase in Latin American capacity could support revenue if demand absorbs the additional seats. If demand falls short, however, higher capacity could put pressure on yields and operating costs.
Capital.com’s client sentiment for IAG CFDs
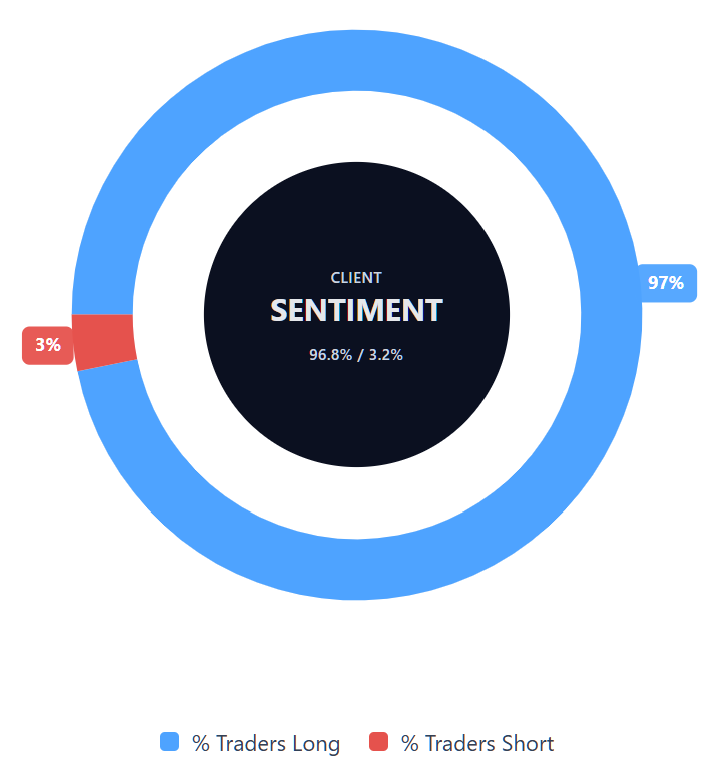
As of 22 September 2026, Capital.com client positioning in IAG CFDs shows 96.8% buyers versus 3.2% sellers.
This snapshot shows that open positions are concentrated on the long side. It reflects Capital.com client positioning at a specific point in time, can change quickly and does not predict future price direction.
Summary – International Consolidated Airlines 2026
- IAG traded at 429.65p at 8:55am UTC on 22 September 2026, within a 422.75p–430.95p intraday range.
- Technical signals on TradingView were mixed, with the price below the 435p pivot, RSI at 55.6 and ADX below 25.
- Fuel costs, passenger demand, yields and capacity could support or weigh on the price depending on how they develop.
- Recent company developments include a €500m share buyback and British Airways' planned 25% increase in Latin American seat capacity for summer 2027.
Past performance is not a reliable indicator of future results.
FAQ
Who owns the most IAG stock?
This article does not identify IAG’s largest individual or institutional shareholder. Ownership can change over time as investors buy or sell shares, so the latest shareholder register or company filings are the best sources for current holdings. For traders, ownership structure is one factor among many. IAG’s share price can also respond to earnings, passenger demand, fuel costs, capacity decisions and wider economic conditions.
What is the five-year IAG share price forecast?
The forecasts covered in this article focus on 12-month analyst targets, not a five-year IAG stock forecast. Central estimates reviewed here range from about 500p to 549p, while individual projections span a much wider range. Longer-term forecasts carry greater uncertainty because they depend on assumptions about demand, fuel prices, costs, capacity and economic conditions. Any five-year IAG share price forecast should therefore be treated as speculative rather than predictive.
Is IAG a good stock to buy?
Whether IAG is suitable depends on your objectives, risk tolerance and wider financial circumstances. This article does not recommend buying or selling the shares. Analysts cited here publish targets above the current price, but their estimates vary considerably. IAG could benefit from resilient passenger demand, lower fuel costs or improved margins, while weaker demand, higher operating costs or disruption could weigh on performance. Third-party forecasts can also prove inaccurate.
Could IAG stock go up or down?
Yes. IAG shares could move in either direction as new information changes expectations. Stronger passenger demand, lower fuel costs or better-than-expected margins could support the price. Higher jet-fuel costs, weaker demand, pressure on fares or operational disruption could weigh on it. Technical levels may help traders assess recent price behaviour, but they do not predict future movements. Analyst forecasts also differ widely, reflecting uncertainty around the company’s outlook.
Should I invest in IAG stock?
This article is for informational purposes and does not provide investment advice. Whether to invest in IAG depends on factors specific to you, including your financial goals, time horizon and tolerance for risk. The company’s outlook is sensitive to passenger demand, fuel prices, capacity and broader economic conditions. Analyst targets and technical indicators can provide context, but neither can reliably determine where the share price will move next.
Can I trade IAG CFDs on Capital.com?
Yes, you can trade International Consolidated Airlines CFDs on Capital.com. Trading share CFDs lets you speculate on price movements without owning the underlying asset and to take long or short positions. However, contracts for difference (CFDs) are traded on margin, and leverage amplifies both profits and losses. You should ensure you understand how CFD trading works, assess your risk tolerance, and recognise that losses can occur quickly.