
Lloyds forecast: will Lloyds share price return to £1? Third party data forecast
Having faced significant challenges over recent years, what might be next for Lloyds Banking Group
Lloyds is a multinational banking institution whose shares have been trading in a range of around 60p to 75p in recent times. In this piece, you’ll find discussion of the share price – with updates added from third-party price forecasts. It was 2008 since it last happened – but when could Lloyds shares return to £1?
When could Lloyds shares reach £1?
Shares of Lloyds Banking Group have faced significant challenges over recent years but remain an attractive proposition for many investors, thanks to the bank’s solid fundamentals. Although the share price briefly stabilised above the 50p mark last year, it remains well short of the £1 level that some market observers have speculated about. Investors continue to monitor economic developments closely, as the recovery from the technical recession seen in late 2023 has been gradual and uneven.
Fundamentally, Lloyds continues to be a cornerstone of the UK banking sector, bolstered by its widely recognised brand and expansive customer base. Recent quarterly reports have shown continued resilience, with post-tax profits growing to around £6bn in 2024—an improvement over previous years. Similarly, interest income, a critical revenue source for banks, has maintained its upward trajectory over the past several years, reflecting the bank’s robust operational performance.
Despite these positive fundamentals, broader market sentiment has tempered the stock’s upside. Persistent concerns over loan defaults, coupled with ongoing inflationary pressures—particularly in the services sector—continue to weigh on investor confidence. While GDP data from late 2024 hinted at a recovery, the growth remains modest and is frequently challenged by global uncertainties. The Bank of England has signalled a more dovish approach in early 2025, yet any easing in interest rates has been cautious, limiting the potential boost to banks’ net interest margins.
From a technical standpoint, Lloyds shares still face a key resistance zone between 68p and 71p from the 2017/18 highs. Recent technical indicators, including the Relative Strength Index (RSI), suggest that while the buying pressure has softened from earlier overbought levels, a decisive move upward will likely require both a sustained improvement in market sentiment and more favourable economic indicators. As it stands, reaching the £1 milestone appears far-fetched in the near term unless the broader economic outlook improves significantly.
Find out more about the macroeconomic drivers of this stock and how to trade Lloyds CFDs here.
Lloyds share price forecast for 2025 and beyond
Forecasts for Lloyds share price in 2025 have recently improved. Citigroup raised its target price from 61p to 71p in March, whilst JPMorgan Chase & Co. raised their price target from 55p to 62p and gave the stock an "underweight" rating in a research note published in February. Meanwhile, Morgan Stanley is more bullish on Lloyd’s shares, with a target rating of 90p.
The rating upgrades are based on improved earnings from higher interest rates in the past few months.The most recent results showed that Lloyds Bank’s business did better than expected. Its net interest income came in at £12.8 billion, while its total net income fell by 5% to £17.1 billion.
Lloyds share price drivers
Lloyds’ share price is driven by a combination of fundamental, macroeconomic, and technical factors. Key drivers include:
-
Interest Rates:
Higher rates tend to improve net interest margins, boosting earnings. Banks benefit from lending at higher rates while deposit costs rise more slowly, which can support share price growth and lead to increased dividends.
-
Earnings Performance:
Strong profitability—especially from retail banking, mortgage lending, and commission-based income—bolsters investor confidence. Earnings trends, particularly in net interest income and operating efficiency, play a crucial role.
-
Regulatory and Legal Factors:
Ongoing uncertainties, such as investigations into motor finance commission issues, can create volatility. The outcomes of regulatory reviews or court cases may impact future liabilities and overall valuation.
-
Macroeconomic Conditions:
The health of the UK economy, including GDP growth, inflation, and consumer confidence, influences credit demand and default rates. Economic resilience can help support higher earnings, while downturns may depress performance.
-
Dividend Policy and Capital Returns:
Consistent dividend payouts and share buybacks attract income-focused investors, often providing support to the share price. Improvements in distribution practices can act as a catalyst for share price appreciation.
-
Market Sentiment and Technical Factors:
Investor sentiment, technical indicators, and key support/resistance levels can drive short-term price movements. For instance, overcoming technical resistance levels might trigger momentum buying.
These drivers interact in complex ways. For example, while higher interest rates boost margins, they might eventually lead to rate cuts if the economy slows, affecting future earnings. Similarly, strong fundamentals might be overshadowed by regulatory risks.
It is also important to take into account how the inclusion of AI can affect the banking sector. AI in banking is transforming operations by streamlining routine tasks such as customer service through chatbots and automating underwriting processes, which in turn reduces costs and boosts efficiency. It also enhances risk management by improving fraud detection and credit risk assessments, while enabling banks to deliver more personalized products and services to their customers. Furthermore, AI supports data-driven decision making and drives innovation with new offerings like robo-advisors and algorithm-based trading. However, these advances also bring challenges, particularly in areas like data privacy and regulatory compliance.
Past performance is not a reliable indicator of future results.
Lloyds fundamental analysis: 2024 earnings
In 2024, Lloyds Banking Group’s share price enjoyed modest growth as investor confidence was buoyed by the bank’s strong fundamentals despite ongoing regulatory concerns. The year’s performance was driven in part by higher interest rates that improved net interest margins, although earnings reports revealed some headwinds. For example, in Q1 2024, the bank experienced a decline of about 12% in net interest income compared to the same period in 2023, reflecting challenges such as deposit churn and margin compression.
However, subsequent quarters showed gradual improvements as cost management initiatives and a recovery in lending volumes helped stabilize earnings. Additionally, the bank’s diversified revenue streams and a consistent dividend policy contributed to bolstering investor confidence, even as concerns over potential liabilities from motor finance commission issues persisted.
Overall, while the year was marked by some volatility, strong fundamentals and operational adjustments enabled Lloyds to finish 2024 with a healthy earnings performance that supported its share price growth.
Lloyds earnings in 2023
On 16 February, Lloyds reported its financial results covering the entire 2023 fiscal year. During the period, underlying net interest income of £13.8bn was up 5%, with a net interest margin of 3.1%, in line with guidance. Statutory profit after tax was £5.5bn (£1.2bn in the fourth quarter) with net income of £17.9bn up 3%.
On the costs front, the bank reported operating costs of some £9.1bn and total costs of around £9.8bn.
The Board recommended a final ordinary dividend of 1.84p per share, resulting in a total ordinary dividend for 2023 of 2.76p per share, up 15% on the prior year.
Lloyds Banking Group 5-year price history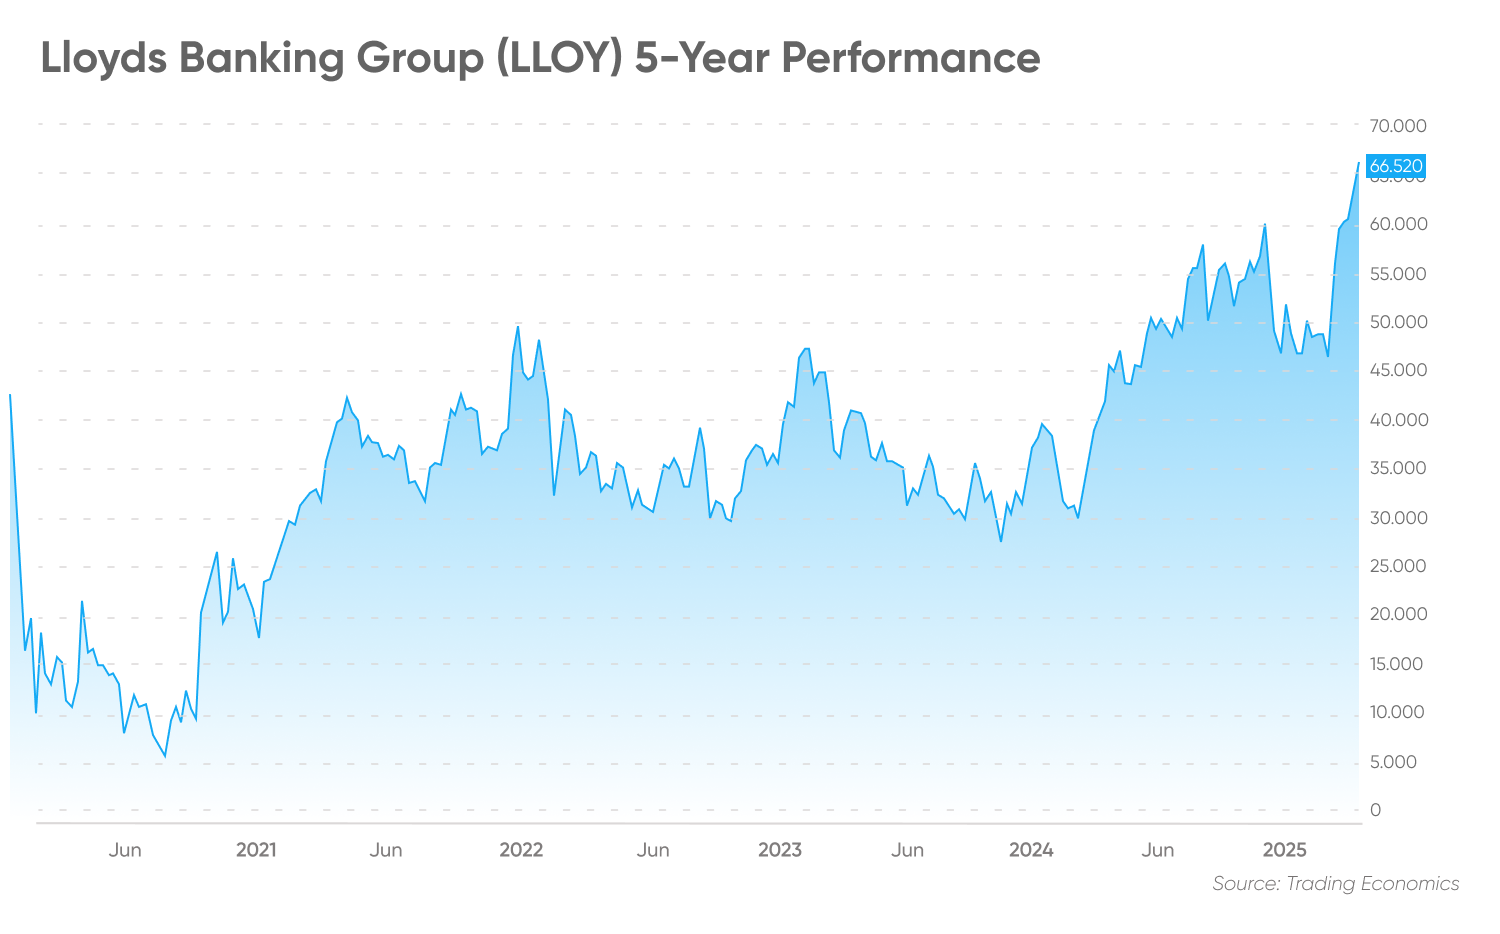
Past performance is not a reliable indicator of future results.
Company history
Lloyds Banking Group, currently the third-largest retail bank in Britain behind Barclays (BARC) and HSBC (HSBA), was founded in Birmingham in 1765. It expanded during the 18th and 19th centuries by taking over a number of smaller banking businesses.
In 1995, the bank merged with the Trustee Savings Bank (TSB) to form Lloyds TSB — at that point the largest bank in the UK by market share, and the second-largest (to HSBC, which had taken over the Midland Bank in 1992) by market capitalisation.
Amidst the credit crunch in 2008, the Lloyds TSB Group took over HBOS – itself formed by a merger between Halifax plc and the Bank of Scotland in 2001. The UK government allowed the deal to bypass competition law with the goal of avoiding another Northern Rock-style collapse. After the rescue of HBOS, the Lloyds TSB Group was renamed Lloyds Banking Group – the name it continues to hold to this day.
In 2009, the British government took a 43.4% stake in the group following the liquidity crisis. The European Commission reacted to the move by ruling that the group must sell a portion of its business by November 2013, as it interpreted the stake purchase as state aid. In March 2017, the British government confirmed that its remaining shares in the group had been sold.
Lloyds Banking Group currently has 28 million customers in the UK and posted statutory profits after tax of £4.5bn in 2024. The group is listed on the London Stock Exchange (LSE) and is a constituent of the benchmark FTSE 100 index.
Lloyds trading strategies to consider
Trading shares can be a rewarding way to grow your portfolio, but success requires more than speculation—it demands a well-defined strategy. By understanding and applying effective trading strategies, you can make informed decisions about when to enter and exit trades, as well as how to manage open positions. Keep in mind that a strategy tailored for other asset classes, such as commodities or currency pairs, may not perform effectively when applied to shares.
Below, we explore key trading strategies and provide actionable insights to enhance your trading skills.
1. Position Trading: Long-Term Gains
Position trading involves holding a position over a longer time horizon to benefit from sustained price movements. For shares, this might mean identifying companies with strong fundamentals and growth potential. Traders often rely on fundamental analysis to evaluate factors like earnings growth, market trends, and competitive positioning.
Insight:
Position trading in shares requires patience and a deep understanding of a company’s intrinsic value. Using tools like discounted cash flow (DCF) analysis can provide a clearer picture of long-term potential.
2. News Trading: Reacting to Market Events
News trading is a short-term strategy that capitalizes on volatility triggered by market-moving events, such as earnings reports, economic data releases, or central bank announcements.
Insight:
For shares, monitoring company-specific news like mergers, product launches, or leadership changes can provide opportunities to act swiftly. Subscribing to real-time market alerts and news feeds can help you stay ahead.
3. Trend Trading: Riding the Momentum
Trend trading involves identifying and following established price trends. Traders use technical analysis to spot patterns, such as moving averages or support and resistance levels, to anticipate price movements.
Insight:
In share trading, combining technical indicators like the Relative Strength Index (RSI) or MACD with fundamental cues can provide a more robust view of potential trends. For example, a strong earnings report could signal the start of an upward trend.
4. Day Trading: Intraday Opportunities
Day traders focus on short-term price movements within a single trading session, leveraging intraday volatility. Shares of large-cap companies with high liquidity and narrow bid-ask spreads are popular choices for this strategy.
Insight:
Day trading requires discipline and fast decision-making. Utilize real-time charting and market data to refine your intraday strategies.
Additional Trading Insights for Success
- Diversify Your Strategies: Instead of relying on a single approach, consider a mix of strategies based on market conditions. For instance, position trading might work well in a bullish market, while trend trading can be effective in volatile conditions.
-
Risk Management is Key: Set clear stop-loss levels and position sizing rules to protect your capital. Even the most effective strategies can lead to losses without proper risk controls.
-
Stay Educated: Regularly update your knowledge of market trends, economic indicators, and sector performance. Enrolling in share trading courses or following expert analysts can deepen your expertise.
-
Leverage Technology: Our platform at capital.com offers MT5 integration to gain a competitive edge. Such tools can analyze vast amounts of data to identify potential trading opportunities.
-
Understand Tax Implications: Be aware of tax regulations in your jurisdiction, as capital gains and losses from share trading can impact your net returns.
Risks and rewards to shares trading
Trading shares successfully requires more than just market knowledge. It requires a disciplined approach to managing both potential rewards and inherent risks. The stock market is dynamic, influenced by a multitude of factors ranging from economic trends to company-specific developments. As such, navigating it without a solid plan can lead to costly mistakes. By taking a balanced approach, traders can mitigate risks while maximizing potential opportunities, ensuring a more sustainable and informed trading journey. To maximize potential rewards and minimize risks:
-
Develop a Strategy: A clear plan with defined goals, risk tolerance, and time horizons can guide your decisions.
-
Use Risk Management Tools: Techniques like stop-loss orders, diversification, and position sizing can help limit losses.
-
Stay Informed: Keep up with market trends, company performance, and global economic indicators.
-
Avoid Over-Leverage: Use margin sparingly and understand the implications of borrowed capital.
-
Embrace Continuous Learning: Markets evolve, and staying educated on new tools and strategies is key to maintaining an edge.
FAQs
Will Lloyds share price go up or down?
According to third-party forecasts the price of Lloyds shares are expected to rise in 2025 given robust performance and strong interest margins.
However, such forecasts are drafted by analysing the historical price trend of Lloyds shares. They should not be considered a recommendation to buy or sell the stock, because many variables could weigh on the short-term and long-term performance of LLOY, and actual results could deviate significantly from these predictions.
Is Lloyds a good share to buy?
Lloyds is a well-established bank with a strong market presence, a diversified revenue base, and an attractive dividend yield, making it appealing to value and income-focused investors. Its extensive customer base in the UK and robust retail franchise provide a solid foundation. However, the stock is not without risks—regulatory uncertainties, particularly around motor finance commissions, and pressures on net interest margins pose challenges.
Whether Lloyds (LLOY) is a suitable asset for your portfolio depends on your own trading objectives and opinion, based on your own research. Remember – it’s important to reach your own conclusion about the company’s prospects and the likelihood of achieving analysts’ targets.
Why has the Lloyds share price been dropping?
As of 28 May 2024, the price of Lloyds Banking Group shares has been dropping as the bank reported falling profits, due to lower net income and higher costs. Moreover, persistent inflation in the UK and a sense of an uncertain economic outlook could affect the demand and performance of loans offered by the bank.
Should I invest in Lloyds?
Whether Lloyds Banking Group shares (LLOY) are a good investment for you depends on your risk tolerance, investing goals and portfolio composition. You should do your own research and never trade money that you cannot afford to lose.