
Novo Nordisk share price forecast: Q2 earnings, raised guidance
Novo Nordisk reported higher adjusted operating profit and raised its 2026 guidance, while Wegovy pill sales growth, competition and a failed trial remained in focus. Explore third-party NVO price targets and technical analysis. Past performance is not a reliable indicator of future results.
Novo Nordisk A/S (NVO) traded at $47.42 as of 3.33pm UTC on 4 August 2026, near the upper end of the day's $46.31–$47.63 intraday range. Past performance is not a reliable indicator of future results.
The price action followed Novo Nordisk's second-quarter 2026 results, published earlier that day, in which the company reported adjusted operating profit of DKK 33,389 million, up 11% at constant exchange rates, and raised its full-year 2026 guidance for adjusted sales and operating profit (GlobeNewswire, 4 August 2026). However, some investors focused on lower-than-expected sales growth for the Wegovy pill, which generated DKK 3.22 billion in the quarter against analyst expectations of DKK 3.27 billion according to StreetAccount data, alongside continued competitive pressure from Eli Lilly in the glucagon-like peptide-1 (GLP-1) market (TradingView, 4 August 2026).
The move also came days after Novo Nordisk reported on 31 July that its late-stage ZEUS trial of ziltivekimab, involving more than 6,300 patients with atherosclerotic cardiovascular disease, chronic kidney disease and elevated inflammation, had failed to reduce major adverse cardiovascular events compared with placebo, with a hazard ratio of 0.99 (Reuters, 31 July 2026). The result had already weighed on sentiment ahead of the earnings release, contributing to a market-value decline reported in the tens of billions of dollars in the prior trading session (Bloomberg, 31 July 2026).
Third-party Novo Nordisk outlook: raised guidance, trial setback
As of 4 August 2026, third-party Novo Nordisk share price predictions reflect differing assessments of the company's second-quarter results and recent clinical-trial developments. The following mini-briefs summarise five consensus and single-rating estimates from that period, ordered from the lowest to the highest target.
The Globe and Mail
The Globe and Mail reports that the most recent analyst rating for Novo Nordisk was 'Hold', with a $45 price target. The figure appeared alongside coverage of the company's ongoing 2026 share buyback programme, under which accumulated purchases had reached DKK 7.16bn by 24 July 2026 (The Globe and Mail, 28 July 2026).
Investing.com
Investing.com states that the average 12-month price target for Novo Nordisk's American depositary receipt (ADR) was $47.87 as of 30 July 2026, representing a potential increase of 8.11%, based on 12 analysts polled over the previous three months, with a high estimate of $63.69 and a low of $40.34. The platform reported an overall 'Buy' consensus, based on four Buy and eight Hold ratings, with no Sell ratings recorded (Investing.com, 30 July 2026).
MarketWatch
MarketWatch reports an average target price of $49.78 for Novo Nordisk ADR, with a high of $69.34 and a low of $30.35, alongside an average 'Overweight' recommendation, as of 31 July 2026. The data covered estimates compiled shortly after the company's Q2 2026 earnings release and the previous week's ziltivekimab trial update, in which the drug failed to reduce major adverse cardiovascular events in the Phase 3 ZEUS study (MarketWatch, 31 July 2026).
Public.com
Public.com reports a price target of $57.92 for Novo Nordisk, with a consensus 'Buy' rating based on six analysts, as of 4 August 2026. The ratings comprised 33% Strong Buy, 17% Buy, 33% Hold and 17% Sell, amid continued attention on sales trends for Wegovy and Ozempic (Public.com, 4 August 2026).
MarketBeat
MarketBeat cites an average price target of $65.56 for Novo Nordisk, with a 'Hold' consensus rating based on 22 analysts, a high estimate of $175 and a low of $40, as of 4 August 2026. The wide spread between estimates followed the company's failed Phase 3 ziltivekimab cardiovascular trial in late July, which Reuters reported prompted a roughly 9% decline in the stock on 31 July 2026, and its subsequent increase to full-year guidance (MarketBeat, 4 August 2026).
Predictions and third-party forecasts are inherently uncertain, as they cannot fully account for unexpected market developments. Past performance is not a reliable indicator of future results.
Novo Nordisk latest earnings: Q2 2026 results
Novo Nordisk published its financial results for the second quarter and first half of 2026 on 4 August 2026, according to a company announcement distributed through GlobeNewswire (GlobeNewswire, 4 August 2026).
The Bagsværd-based drugmaker reported Q2 2026 net sales of DKK 78,488m, up 3% at constant exchange rates (CER) compared with the prior-year quarter, alongside adjusted operating profit of DKK 33,389m, up 11% at CER, driven by GLP-1 volume growth and favourable US rebate adjustments (Investegate, 4 August 2026). Reuters reported that the adjusted operating profit figure exceeded a company-compiled analyst poll forecast of DKK 28.74bn (Reuters, 4 August 2026).
The company stated that its oral Wegovy pill had exceeded 5 million cumulative US prescriptions since launch, and it raised its full-year 2026 outlook for adjusted sales and adjusted operating profit growth at CER to a range of 0% to minus 6%, an improvement from its previous guidance range of minus 4% to minus 12% (Yahoo Finance, 4 August 2026).
The company said it would host a conference call for investors at 1pm CEST (7am EDT) on 5 August 2026 to discuss the results in further detail, with dial-in access available through its investor relations channels (Novo Nordisk, 4 August 2026). Novo Nordisk's next scheduled disclosure is its Q3 2026 quarterly report, which the company's financial calendar lists for 4 November 2026 (Novo Nordisk, 4 August 2026).
Past or simulated performance, including prior earnings results, is not a reliable indicator of future results.
NVO share price: technical overview
The NVO share price (ADR) trades near $47.42, just below its 20-, 50-, 100- and 200-day simple moving averages according to TradingView, which sit at approximately $49, $47, $44 and $47, respectively, according to data compiled by TradingView.
A bullish alignment between the 20- and 50-day averages remains intact within that cluster. However, the stock's position below the broader group points to a mixed near-term structure rather than a clearly established trend.
TradingView data also shows the 200-day exponential moving average at around $49.49. This level sits above its simple-moving-average counterpart and represents the nearest longer-term reference point above the price.
Momentum readings from TradingView place the 14-day relative strength index (RSI) at 44.50, in neutral to slightly weaker territory, without registering an overbought or oversold extreme.
The 14-day average directional index (ADX) reads 21.44. TradingView classifies this level as neither firmly trending nor clearly weak, so this analysis does not treat it as a standalone signal.
Above the current price, TradingView's classic pivot model places the pivot point at $48.54 as the nearest reference. Under the same model, a daily close above this level would bring the R1 marker near $50.65 into focus.
Below the current price, TradingView data shows the 50- and 200-day simple moving averages clustered around $46.94 and $46.85, forming an initial reference area. A move below that area would bring the classic S1 pivot near $44.97 into focus, according to TradingView (TradingView, 4 August 2026).
This is technical analysis for informational purposes only and does not constitute financial advice or a recommendation to buy or sell any instrument.
Novo Nordisk share price history (2024–2026)
As of 3.33pm UTC on 4 August 2026, NVO’s share price (ADR) traded as high as $139.81 in August 2024 before declining throughout 2025 amid increasing competitive pressure in the GLP-1 weight-loss market.
The stock closed 2024 at $86.22, then continued lower through 2025, ending the year at $50.90 as investors considered several trial updates and guidance revisions.
The decline extended into 2026, with NVO touching a two-year low of $35.14 on 30 March before recovering through the spring and summer. Shares had traded above $60 in late January, then declined through February and March before a steadier rebound carried the price back towards $50 during June and July.
NVO closed at $47.38 on 4 August 2026, around 9.7% lower year to date and 3.2% lower year on year, according to the price data shown here.
Past performance is not a reliable indicator of future results, and historical price levels should not be relied upon when assessing potential future price movements.

Past performance is not a reliable indicator of future results. Share prices are indicative and may differ from live market prices.
Novo Nordisk (NVO): Capital.com analyst view
Novo Nordisk's ADR traded across a relatively broad range during the first seven months of 2026, broadly between $35 and $60, after a sharper decline through 2025 from levels above $100.
The stock's recovery from its March 2026 low coincided with quarterly earnings updates and an increase in full-year guidance. However, the failed late-stage ziltivekimab cardiovascular trial in late July 2026 also showed how clinical setbacks could offset favourable commercial developments, such as growth in prescriptions for the Wegovy pill.
Some market participants view Novo Nordisk's raised 2026 outlook and continued GLP-1 demand as potentially supportive factors for the shares. Others highlight increasing competition from rival manufacturers and pricing pressure in the US market as potential headwinds.
Analyst price targets published in the weeks leading up to 4 August 2026 span roughly $45–$66, reflecting a range of views. Both interpretations remain speculative, and neither should be read as an indication of likely future price direction.
Past or simulated performance, including past price levels and prior analyst commentary, is not a reliable indicator of future results. This content is for informational purposes only and does not constitute financial advice or a recommendation to buy or sell any instrument.
Capital.com’s client sentiment for Novo Nordisk CFDs
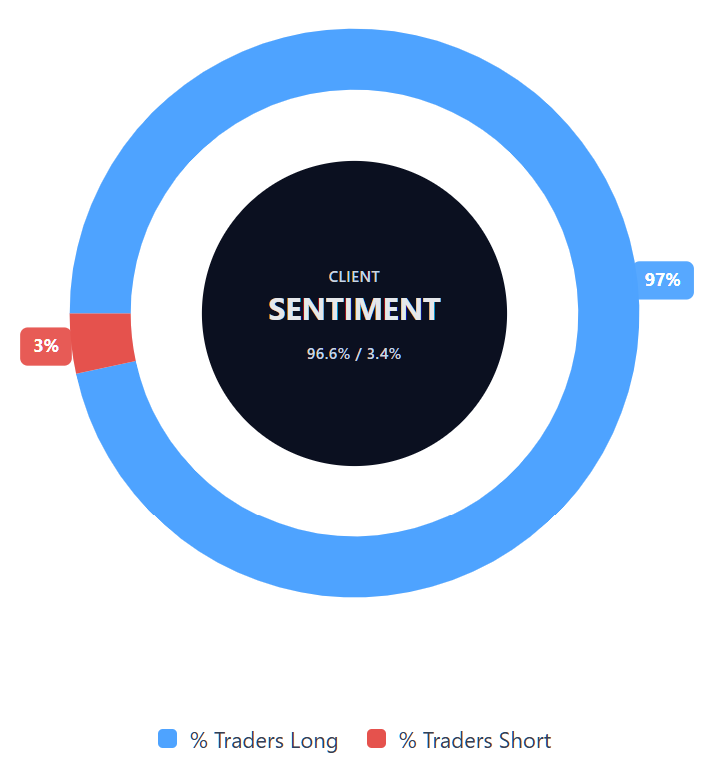
As of 4 August 2026, Capital.com client positioning in Novo Nordisk CFDs shows 96.6% of open positions held by buyers and 3.4% by sellers.
Buyers therefore accounted for 93.2 percentage points more of open positions than sellers, reflecting a pronounced imbalance among Capital.com clients with open positions in the market. This snapshot can change over time.
Past or simulated performance, including client sentiment data, is not a reliable indicator of future results and does not constitute financial advice or a recommendation to buy or sell any instrument.
Summary – Novo Nordisk 2026
- As of 3.33pm UTC on 4 August 2026, Novo Nordisk (NVO) traded near $47.42, well below its 2024 high of $139.81 but close to its level at the end of 2025.
- The stock fell from $139.81 in August 2024 to a two-year low of $35.14 in March 2026 before partially recovering through mid-2026.
- According to TradingView, the price remained below its moving-average cluster, while the 14-day RSI sat in neutral to slightly weaker territory and the ADX indicated no firmly established directional trend.
- The main factors in focus include GLP-1 competition, Wegovy prescription growth, clinical-trial outcomes, quarterly earnings and changes to company guidance.
Past performance is not a reliable indicator of future results.
FAQ
Who owns the most Novo Nordisk shares?
The article does not identify Novo Nordisk’s largest shareholder or provide a breakdown of institutional, government or individual ownership. Shareholding data can also change as investors adjust their positions. To assess current ownership, readers would need to consult Novo Nordisk’s latest shareholder disclosures, regulatory filings or investor-relations materials. Ownership concentration may affect voting influence, but it does not indicate how the share price will perform.
What is the five-year Novo Nordisk share price forecast?
The article does not provide a five-year NVO share price forecast. The third-party targets cited cover shorter, typically 12-month periods and range from $45 to $65.56. Longer-term forecasts involve greater uncertainty because they depend on factors such as GLP-1 demand, competition, pricing pressure, clinical-trial results and future guidance. Any five-year estimate would remain speculative and should not be treated as a reliable prediction.
Is Novo Nordisk a good stock to buy?
Whether Novo Nordisk is suitable depends on an individual’s objectives, risk tolerance and wider financial circumstances. The article presents both potential supporting factors, including raised 2026 guidance and continued GLP-1 demand, and risks such as stronger competition, pricing pressure and clinical-trial setbacks. Analyst views also vary widely. These factors do not establish whether the stock is a good buy, and the information should not be considered financial advice.
Could Novo Nordisk shares go up or down?
Novo Nordisk shares could move in either direction. Potential upward drivers include stronger-than-expected earnings, prescription growth, successful clinical trials or improved guidance. Downward pressure could come from weaker sales, increased competition, pricing changes or disappointing trial results. The technical indicators in the article also point to a mixed market structure rather than a clear trend. Past performance and analyst targets do not reliably indicate future price movements.
Should I invest in Novo Nordisk shares?
The article does not recommend investing in Novo Nordisk shares. It outlines recent price performance, analyst targets, earnings, technical indicators and market risks to help readers understand the factors affecting the stock. Any investment decision should reflect personal objectives, financial circumstances and tolerance for loss. Novo Nordisk may offer exposure to the pharmaceutical and GLP-1 markets, but its shares remain sensitive to competition, regulation, pricing and clinical developments.
Can I trade Novo Nordisk CFDs on Capital.com?
Yes, you can trade Novo Nordisk CFDs on Capital.com. Trading share CFDs lets you speculate on price movements without owning the underlying asset and to take long or short positions. However, contracts for difference (CFDs) are traded on margin, and leverage amplifies both profits and losses. You should ensure you understand how CFD trading works, assess your risk tolerance, and recognise that losses can occur quickly.