
easyJet share price forecast: Apollo takeover offer agreed
easyJet is a UK-listed airline that agreed a £5.7bn takeover by Apollo Global in August 2026, with shareholders offered £7.15 per share in cash. Explore third-party EZJ price targets and technical analysis. Past performance is not a reliable indicator of future results.
easyJet plc. (EZJ) is trading near £6.73 in early afternoon trading on 10 August 2026, within an intraday range of £6.64–£6.73. Past performance is not a reliable indicator of future results.
The move follows Apollo Global's agreement, announced on 6 August 2026, to acquire easyJet in a deal valuing the airline at about £5.7bn. The board has recommended the £7.15-per-share cash offer after rival bidder Castlelake withdrew from the process (Reuters, 6 August 2026).
Shares continue to trade below the offer level as investors assess factors that could affect completion, including European Union rules requiring majority EU ownership for airlines operating in the bloc (Kalkine Media, 3 August 2026). Separately, unions have filed a strike notice covering easyJet France cabin crew for 7 August to 2 September 2026, citing deteriorating working conditions (Reuters, 4 August 2026).
Third-party easyJet outlook: Apollo takeover deal
As of 10 August 2026, third-party easyJet share price predictions indicate possible future prices rather than outcomes that are certain to occur. The targets below were captured between 20 July and 10 August 2026, with the time horizon included where the publisher provides one.
Simply Wall St (fair-value estimate)
Simply Wall St reports an analyst-consensus fair-value estimate of £5.87 per share, captured on 20 July 2026, up from a prior £4.48. The estimate reflects changes in underlying analyst inputs amid uncertainty over the proposed takeover process (Simply Wall St, 20 July 2026).
Investing.com (12-month consensus)
Investing.com's 3 August 2026 capture places the 12-month average analyst target at £6.27, with a low of £3.60 and a high of £7.15, based on 14 analysts. The spread between these estimates highlights differing assumptions about operating performance and the outcome of takeover discussions (Investing.com, 3 August 2026).
JPMorgan (broker target)
JPMorgan raised its price target to £7.15 from £3.60 and assigned a Neutral rating in research reported on 7 August 2026. The revised target follows the agreed Apollo transaction terms, which set the proposed cash consideration at £7.15 per easyJet share (MarketBeat, 7 August 2026).
Investing.com (12-month consensus update)
Investing.com's 7 August 2026 capture shows a 12-month average target of £6.47 from 13 analysts, with estimates ranging from £4.50 to £7.15. The highest published estimate matches the proposed Apollo cash offer, while the lower estimates reflect different assessments of easyJet outside the takeover terms (Investing.com, 7 August 2026).
MarketBeat (12-month consensus)
MarketBeat's 9 August 2026 capture puts the average 12-month analyst target at £6.30, with a high of £8.50 and a low of £3.40, and records a Hold consensus rating. The wide range points to differing assumptions about factors such as earnings, fuel costs and the proposed acquisition (MarketBeat, 9 August 2026).
Predictions and third-party forecasts are inherently uncertain, as they cannot fully account for unexpected market developments. Past performance is not a reliable indicator of future results.
easyJet upcoming/latest earnings
easyJet's latest reported earnings were its Q3 FY2026 trading update, published on 23 July 2026 for the three months ended 30 June 2026 (easyJet, 23 July 2026). The airline reported headline profit before tax of £85m, compared with £286m in Q3 FY2025, while group revenue increased 2% year on year to £2.98bn (Reuters, 23 July 2026). It carried 25.8m passengers and reported an 88.9% load factor, down one percentage point year on year (easyJet, 23 July 2026).
The company attributed the lower quarterly profit to the Middle East conflict, which affected fuel prices, booking visibility and some travel demand (Bloomberg, 23 July 2026). Fuel costs increased 17% year on year to £732m, while fuel cost per available seat kilometre rose 13%. Excluding fuel, headline airline cost per available seat kilometre increased 3%, while revenue per available seat kilometre declined 3% (easyJet, 23 July 2026).
Against that backdrop, easyJet said its late-booking trend remained strong (Reuters, 23 July 2026). Its holidays division reported headline profit before tax of £84m, compared with £86m a year earlier, while revenue rose 14% to £489m (easyJet, 23 July 2026).
As of 10 August 2026, easyJet's investor financial calendar does not show a further scheduled earnings release (easyJet, 10 August 2026). The group's next regular financial-results milestone would ordinarily be its full-year FY2026 results, covering the year ending 30 September 2026, although the company calendar did not state a publication date as of 10 August (easyJet, 10 August 2026). The Q3 figures are unaudited, and easyJet stated that external conditions, including fuel-price movements and booking patterns, continued to create uncertainty around the FY2026 financial outcome (easyJet, 23 July 2026).
EZJ share price: technical overview
As of 12:47pm UTC on 10 August 2026, the EZJ share price trades at £6.73, near the session high of £6.73 and above the intraday low of £6.64. TradingView technical inputs place the share above its 20-, 50-, 100- and 200-day simple moving averages, at approximately £6.44, £5.80, £4.73 and £4.74, respectively. The 20-day average remains above the 50-day average, while the 200-day exponential moving average sits near £4.96 and above the corresponding simple average.
The momentum indicators add further context but do not all measure the same aspect of price behaviour. The 14-day relative strength index (RSI) is 66.6, while the 14-day average directional index (ADX) is 25.2, which suggests some directional strength under conventional interpretations of the indicator. The 14-day stochastic %K is 93.0 and Williams %R is −6.7, placing both shorter-term oscillators near the upper ends of their respective ranges. The moving-average and oscillator figures are sourced from TradingView’s supplied technical data.
For reference, the nearest classic resistance level is R1 at £6.95, above the current price, followed by R2 at £7.59. The Hull moving average is positioned at £6.78. Below the market, the classic pivot stands at £6.19, followed by S1 at £5.55. The 100-day simple moving average near £4.73 provides another longer-term technical reference if the share price moves lower (TradingView, 10 August 2026).
These levels describe where selected technical indicators currently sit; they do not determine where the price will move next.
This is technical analysis for informational purposes only and does not constitute financial advice or a recommendation to buy or sell any instrument.
easyJet share price history (2024–2026)
EZJ’s share price traded around £4.34 on 12 August 2024. The share moved gradually higher through late 2024, reaching £5.33 on 30 September, before trading mostly between about £5.10 and £5.60 at the start of 2025.
The price then rose to an intraday high of £6 on 10 June 2025 before easing through the second half of the year to close at £5.11 on 31 December. That decline continued into early 2026: EZJ fell from £5.17 on 2 January to an intraday low of £3.33 on 18 May.
A recovery then followed. EZJ closed above £4 on 29 May, passed £5 on 17 June and reached £6.05 on 23 July. Daily ranges also widened during parts of this period, including a £5.90–£6.79 range on 6 August. EZJ closed at £6.73 on 10 August 2026, around 54.8% above its closing level on 12 August 2024.
Over the full period, the price therefore moved through several distinct phases rather than following a consistent direction, ranging from the May 2026 low of £3.33 to levels above £6 later in the year.

Past performance is not a reliable indicator of future results. Share prices are indicative and may differ from live market prices.
easyJet (EZJ): Capital.com analyst view
easyJet (EZJ) trades at £6.73 at 12:47pm UTC on 10 August 2026, following a recovery from the £3.33 low recorded on 18 May 2026. Recent price action has taken place alongside several company-specific developments. The company’s Q3 FY2026 update reported headline profit before tax of £85m, down from £286m a year earlier, while revenue rose 2% to £2.98bn.
Higher fuel costs and travel disruption linked to the Middle East conflict weighed on profitability. At the same time, easyJet reported 25.8m passengers and a 14% increase in easyJet holidays revenue, illustrating a mixed operating picture across the group.
The share’s recent move has also coincided with Apollo Global’s agreed £7.15-per-share cash offer, announced after Castlelake withdrew from the process. The offer provides a defined transaction reference point, but the market price remains below it, which may reflect factors such as regulatory and completion risk.
The significance of the £7.15 offer price also depends on the transaction proceeding on the stated terms. Changes to its timing, structure or regulatory outcome could alter the relevance of that level. Beyond the proposed acquisition, operational costs, booking patterns, fuel prices and consumer demand remain among the factors that may influence easyJet’s financial performance and share-price movements
Capital.com’s client sentiment for easyJet CFDs
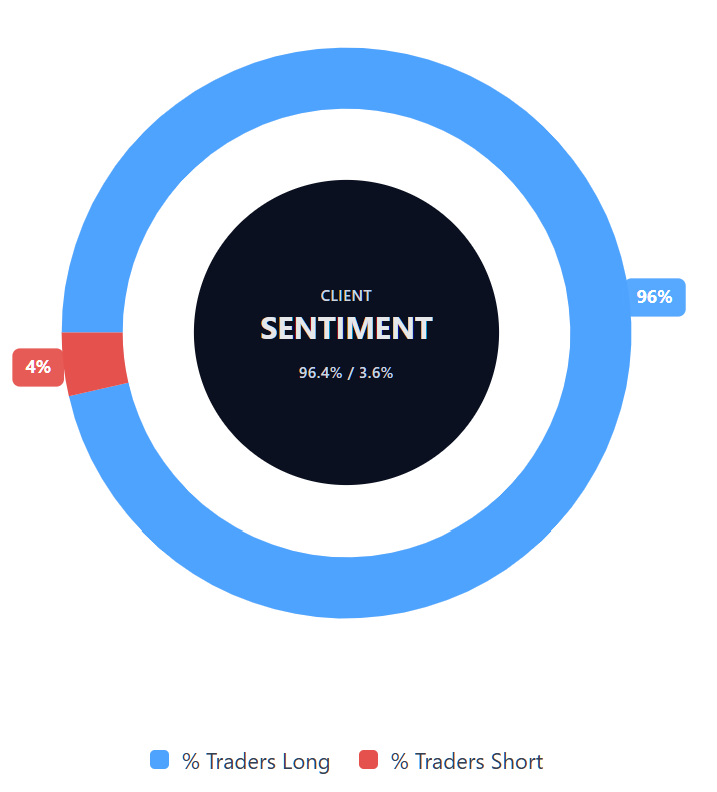
As of 10 August 2026, Capital.com client positioning in easyJet CFDs shows buyers at 96.4% versus sellers at 3.6%, meaning buyers account for the large majority of open positions in this snapshot.
Client sentiment describes positioning rather than a forecast of future price direction. The figures reflect open positions among Capital.com clients rather than the wider market and can change over time.
Summary – easyJet 2026
- At 12:47pm UTC on 10 August 2026, easyJet traded near £6.73, up from the May 2026 low of £3.33 and above the £6 intraday level recorded on 10 June 2025.
- According to TradingView data, the price sits above its 20-, 50-, 100- and 200-day moving averages. RSI is near 66.6 and ADX near 25.2, while shorter-term oscillators including stochastic %K and Williams %R sit near the upper ends of their respective ranges.
- Technical indicators provide reference points rather than predictions, and different indicators can give different information about trend, momentum and potential support or resistance.
- Company-specific factors include Apollo Global's agreed £7.15-per-share takeover offer, the decline in Q3 FY2026 profit, higher fuel costs and Middle East-related travel disruption.
- Recent developments also include Castlelake's withdrawal from the bidding process, regulatory considerations relating to EU airline ownership rules and a strike notice covering easyJet France cabin crew.
Past performance is not a reliable indicator of future results.
FAQ
Who owns the most easyJet shares?
What is the five-year easyJet share price forecast?
Is easyJet a good stock to buy?
Could easyJet shares go up or down?
Should I invest in easyJet shares?
Can I trade easyJet CFDs on Capital.com?
Yes, you can trade easyJet CFDs on Capital.com. Trading share CFDs lets you speculate on price movements without owning the underlying asset and to take long or short positions. However, contracts for difference (CFDs) are traded on margin, and leverage amplifies both profits and losses. You should ensure you understand how CFD trading works, assess your risk tolerance, and recognise that losses can occur quickly.