
Rolls-Royce share price: guidance raised after H1 results
Rolls-Royce reported a 46% rise in underlying operating profit for H1 2026 and raised its full-year guidance following results published on 30 July. Explore third-party RR. price targets and technical analysis. Past performance is not a reliable indicator of future results.
Rolls-Royce Holdings plc. (RR.) last traded at £15.53 as of 3:59pm UTC on 10 August 2026, within an intraday range of £15.27–£15.56. Past performance is not a reliable indicator of future results.
Those results, published on 30 July 2026, showed underlying operating profit rising 46% year on year to £2.5bn, while revenue increased 26% to £11.28bn. Rolls-Royce also raised its full-year guidance to £4.7bn–£4.9bn in underlying operating profit and £3.8bn–£4.0bn in free cash flow (Rolls-Royce, 30 July 2026). Its Defence division reported increased submarine-related activity and UK defence investment commitments linked to the AUKUS programme (Defence Industry Europe, 4 August 2026). Meanwhile, wider market conditions included a US dollar trading near a two-month low after weaker-than-expected US jobs data (ts2.tech, 10 August 2026).
Third-party Rolls-Royce outlook: H1 results, guidance
As of 10 August 2026, third-party Rolls-Royce share price predictions outline possible 12-month share-price levels based on analysts' assumptions and should not be treated as predictions of actual future performance.
MarketBeat (analyst consensus)
MarketBeat reports an average 12-month Rolls-Royce target of £14.47 as of 27 July 2026, with a £14.30–£16.25 range and a Moderate Buy consensus from seven ratings firms. The aggregation reflects five buy and two hold ratings, showing that individual analysts apply different assumptions to the company's outlook (MarketBeat, 27 July 2026).
Investing.com (analyst consensus)
Investing.com places the average 12-month target at £16.27 as of 7 August 2026, based on 20 analysts, with estimates from £11.01 to £19. The data provider records buy, hold and sell recommendations within the compilation, indicating a broad spread of published expectations (Investing.com, 7 August 2026).
Deutsche Bank Research (maintained rating)
Deutsche Bank Research maintains a buy rating and a £17.05 price target for Rolls-Royce as of 5 August 2026, up from £13.25. The target represents the broker's 12-month valuation assessment following its estimate review (Yahoo Finance, 5 August 2026).
JPMorgan (maintained rating)
JPMorgan maintains an overweight rating and raised its Rolls-Royce price target to £18 from £16.25 as of 4 August 2026. The forecast followed the company's first-half release and higher full-year underlying operating-profit and free-cash-flow guidance (Proactive Investors, 4 August 2026).
Jefferies (maintained rating)
Jefferies maintains a buy rating and an £18.70 price target for Rolls-Royce as of 30 July 2026. The broker's forecast remained in place after the company reported first-half results and revised its 2026 guidance (MarketScreener, 30 July 2026).
Predictions and third-party forecasts are inherently uncertain, as they cannot fully account for unexpected market developments. Past performance is not a reliable indicator of future results.
Latest and upcoming earnings
Rolls-Royce published its 2026 half-year results on 30 July 2026, reporting revenue of £11,279m, up from £9,057m a year earlier, and underlying operating profit up 46% to £2,534m, with margin rising to 22.5% from 19.1%. Free cash flow reached £1,964m, up from £1,582m, while net cash stood at £2,136m at 30 June 2026, up from £1,895m at 31 December 2025, providing the basis for raised guidance (Rolls-Royce, 30 July 2026).
The company now expects full-year underlying operating profit of £4.7bn–£4.9bn and free cash flow of £3.8bn–£4.0bn, up from £4.0bn–£4.2bn and £3.6bn–£3.8bn previously (Rolls-Royce, 30 July 2026). Reuters reported the outlook exceeded market expectations of around £4.2bn and that shares rose more than 5% on the announcement (Reuters, 30 July 2026).
Chief executive Tufan Erginbilgiç covered growth across civil aerospace, defence and power systems, plus AUKUS-related and autonomous propulsion activity, during the earnings call (MarketScreener, 30 July 2026).
Rolls-Royce's financial calendar lists 2026 full-year results as its next scheduled disclosure, expected in February 2027, with no specific date confirmed as of 10 August 2026 (Rolls-Royce, 3 August 2026).
RR. share price: technical overview
The RR. share price trades at 1,552.5p (£15.53) as of 3:59pm UTC on 10 August 2026, within the session's 1,527.5p–1,556.2p (£15.28–£15.56) range, according to TradingView data.
The stock sits above its 20-, 50-, 100- and 200-day simple moving averages (SMAs), at approximately 1,440p (£14.40), 1,402p (£14.02), 1,306p (£13.06) and 1,251p (£12.51) respectively. The 20-day SMA also remains above the 50-day SMA. Together, these levels show where the current price sits relative to several commonly used trend measures, without indicating what may happen next.
The 14-day relative strength index (RSI) stands at 65.2, below the commonly used 70 level associated with overbought conditions. The nine-day Hull moving average, at 1,562.9p (£15.63), sits slightly above the last traded price and provides another near-term technical reference.
Within TradingView's classic pivot framework, the price has moved above the R1 pivot near 1,547p (£15.47). The next reference is R2 near 1,627p (£16.27), followed by R3 near 1,813p (£18.13). These are reference levels rather than forecasts, and there is no indication that the price will reach them.
On the downside, the classic pivot point near 1,441p (£14.41) provides an initial reference, with S1 near 1,361p (£13.61) below it. The 100-day SMA near 1,306p (£13.06) offers a further reference if the price moves lower, according to the same TradingView dataset. (TradingView, 10 August 2026).
This is technical analysis for informational purposes only and does not constitute financial advice or a recommendation to buy or sell any instrument.
Rolls-Royce share price history (2024–2026)
RR.’s share price rose from roughly £4.90 in mid-August 2024 to £15.51 by 10 August 2026. The move was not linear, with periods of sharp gains and pullbacks across the two-year period.
The share price rose more than 15% after the company's February 2025 full-year results, reaching a then-record high near £7.35 after Rolls-Royce reinstated its dividend and announced a new share buyback. Some of those gains later reversed in April 2025, when Donald Trump's tariff announcements contributed to a broad sell-off. Rolls-Royce shares fell from around £7.79 to a one-month low near £6.35 before recovering by early May.
The stock moved higher again through late 2025 and into 2026. It reached an intraday all-time high near £14.20 in late February 2026, on a day when geopolitical tensions linked to Iran intensified, before falling by more than 10% to around £12.16.
Another period of gains followed from June 2026. Shares rose from around £12.35 to £15.51 by 10 August 2026, during a period that included a Berenberg upgrade in mid-June and Rolls-Royce's stronger-than-expected half-year results on 30 July, alongside higher full-year guidance.

Past performance is not a reliable indicator of future results. Share prices are indicative and may differ from live market prices.
Rolls-Royce (RR.): Capital.com analyst view
Rolls-Royce's share price has continued its longer-term rise through 2026, during a period of consecutive earnings beats, upgraded full-year guidance and higher published analyst price targets following the company's 30 July half-year results.
The underlying operating picture has also changed. Rolls-Royce reported growth across its civil aerospace, defence and power systems divisions, while continuing its transformation programme and share buyback activity. These developments form part of the backdrop to recent analyst revisions, although they do not determine future share-price performance.
At the same time, the share price has risen by more than 30% since the start of 2026. Some analyst commentary therefore considers how much expected future growth may already be reflected in the valuation. If future results differ from market expectations, either positively or negatively, the share price could react accordingly.
Capital.com’s client sentiment for Rolls-Royce CFDs
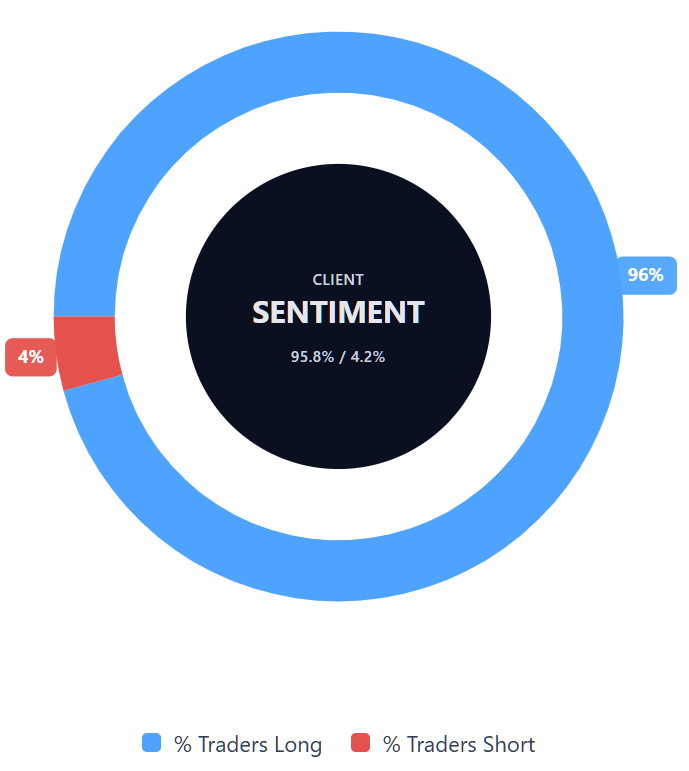
As of 10 August 2026, Capital.com client positioning in Rolls-Royce CFDs is weighted towards long positions, with 95.8% of positions held by buyers and 4.2% by sellers. This puts buyers ahead by 91.6 percentage points.
Client sentiment shows how Capital.com clients are positioned at a given point in time. It does not indicate how the market will move and can change as positions are opened and closed.
Summary – Rolls-Royce 2026
- As of 2:59pm UTC on 10 August 2026, Rolls-Royce (RR.) traded near £15.53, compared with around £4.90 in August 2024.
- According to TradingView data, the price is above its 20-, 50-, 100- and 200-day moving averages, while the RSI stands at 65.2. These indicators describe current technical conditions rather than future direction.
Past performance is not a reliable indicator of future results.
FAQ
What is the five-year Rolls-Royce share price forecast?
The forecasts covered in this article focus on 12-month analyst price targets rather than a five-year Rolls-Royce share price forecast. Recent targets cited range from £11.01 to £19, reflecting different assumptions about the company's future performance. Longer-term forecasts involve greater uncertainty because earnings, aerospace demand, defence spending, cash generation and wider economic conditions can change considerably over several years. Analyst targets are estimates, not guarantees of future prices.
Is Rolls-Royce a good stock to buy?
Whether Rolls-Royce is suitable to buy depends on an individual's objectives, risk tolerance and circumstances, so there is no single answer. The company has reported higher earnings and raised its 2026 guidance, while analysts have also revised some price targets. However, risks remain, including execution challenges, supply-chain constraints and the possibility that expectations are already reflected in the share price. This information should not be considered a recommendation to buy or sell Rolls-Royce shares.
Could Rolls-Royce shares go up or down?
Yes. Rolls-Royce shares can move in either direction as market participants respond to company results, guidance, analyst expectations and wider economic or geopolitical developments. Factors discussed in this article include civil aerospace activity, defence spending, engine aftermarket demand, cash generation and supply-chain conditions. Technical indicators and analyst price targets can provide additional context, but neither can reliably predict future movements. Past share-price performance is also not a reliable indicator of future results.
Should I invest in Rolls-Royce shares?
This article cannot determine whether you should invest in Rolls-Royce shares or provide personal investment advice. Investors may consider factors such as the company's financial performance, valuation, business outlook and relevant risks when conducting their own research. Rolls-Royce has raised its 2026 guidance, but future results could still differ from company or market expectations. Individual investment decisions should take account of personal financial circumstances, objectives and tolerance for risk.
Can I trade Rolls-Royce CFDs on Capital.com?
Yes, you can trade Rolls-Royce CFDs on Capital.com. Trading share CFDs lets you speculate on price movements without owning the underlying asset and to take long or short positions. However, contracts for difference (CFDs) are traded on margin, and leverage amplifies both profits and losses. You should ensure you understand how CFD trading works, assess your risk tolerance, and recognise that losses can occur quickly.