
National Grid share price: group restructure
National Grid announced plans to simplify its group structure on 3 August 2026, while continuing its previously outlined £70bn energy network investment programme. Explore third-party NG. price targets and technical analysis. Past performance is not a reliable indicator of future results.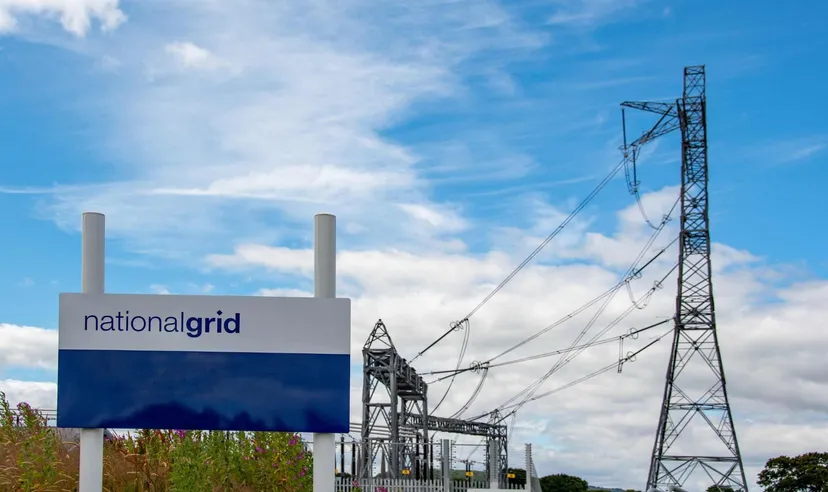
National Grid plc. (NG.) traded at £11.91 in early European hours on 10 August 2026, moving within an intraday range of £11.82–£12.04 as of 10:07am UTC. Past performance is not a reliable indicator of future results.
National Grid announced on 3 August 2026 that it would simplify its group operating structure, reducing its executive committee from 13 to eight members effective 1 September 2026, and creating dedicated UK and US regional president roles, with Cordi O'Hara appointed President, UK, and Sally Librera named Interim President, US (Financial Times, 7 August 2026).
The announcement came as the company continues its previously outlined £70 billion energy network investment programme, which National Grid confirmed at its 2025/26 full-year results on 14 May 2026, with delivery mechanisms secured for around three-quarters of the plan and two-thirds already covered by regulatory agreements (Morningstar, 14 May 2026).
Meanwhile, recent heatwave conditions have brought electricity system capacity into focus for the wider UK utilities sector, with the National Energy System Operator restricting power exports to European interconnectors linking the UK with Norway, Denmark, Belgium and France (Mining.com.au, 10 August 2026). The grid operator had earlier issued a rare summer Electricity Margin Notice on 8 July 2026, citing a forecast margin shortfall of about 1.2 gigawatts during peak evening demand (Bloomberg, 8 July 2026).
Third-party National Grid outlook: management changes
As of 10 August 2026, third-party National Grid share price predictions reflect a range of outlooks. Each refers to a 12-month share-price target rather than a forecast for the Capital.com CFD price.
UBS (maintained sell view)
UBS maintains a Sell rating and a £11.50 12-month target price for National Grid, with the target captured on 3 August 2026. Its latest published rating update left the target unchanged (MarketScreener, 3 August 2026).
Jefferies (revised hold view)
Jefferies set a Hold rating and a £13 12-month target price on 3 August 2026, reduced from £14.10. The revision followed the broker's latest valuation review of National Grid (MarketBeat, 3 August 2026).
Investing.com (analyst consensus)
Investing.com reports a Neutral consensus rating for National Grid, with an average 12-month target of £13.62 across 15 tracked analysts, ranging from £10.60 to £15, as captured on 6 August 2026. The panel comprised 7 Buy, 6 Hold and 2 Sell recommendations (Investing.com, 6 August 2026).
MarketBeat (analyst consensus)
MarketBeat reports a Hold consensus rating for National Grid, with a seven-analyst average 12-month target of £13, ranging from a low of £11.60 to a high of £14.40, as captured on 8 August 2026. The panel comprised 3 Buy, 3 Hold and 1 Sell rating (MarketBeat, 8 August 2026).
Predictions and third-party forecasts are inherently uncertain, as they cannot fully account for unexpected market developments. Past performance is not a reliable indicator of future results.
National Grid: latest and upcoming earnings
National Grid's most recent scheduled corporate reporting was its 2025/26 full-year results, covering the period ended 31 March 2026, published on 14 May 2026. The company reported underlying operating profit up 9% to £5.7bn, while underlying earnings per share rose 8% to 78.0p (£0.78) (National Grid, 14 May 2026).
Statutory IFRS earnings were £3,241 million in 2025/26, £415 million (15%) higher than the prior year, while gross revenue from continuing operations fell 4% to £17.687bn. Capital investment rose 21% to £11.6bn, which the company linked to 10.9% growth in regulated asset value (National Grid, 14 May 2026). The board recommended a final dividend of 32.14p (£0.3214) per ordinary share, bringing the full-year dividend to 48.49p, an increase of 3.8% on 2024/25; the final dividend was paid on 23 July 2026 to shareholders registered as at 29 May 2026 (MarketScreener, 14 May 2026).
Following the results, National Grid held its annual general meeting on 14 July 2026, according to its published financial calendar (National Grid, 14 May 2026). Its next scheduled reporting event is the 2026/27 half-year results on 5 November 2026 (Investing.com, 10 August 2026).
NG. share price: technical overview
As of 10:07am UTC on 10 August 2026, the NG. share price trades below its 20/50/100/200-day simple moving averages, at around 1,215 / 1,219 / 1,248 / 1,232, according to TradingView data. The 200-day exponential moving average sits closer to the current price, near 1,213, providing an additional longer-term technical reference.
With the 20-day average below the 50-day average, TradingView's data does not indicate a bullish moving-average alignment. Momentum indicators also suggest limited directional strength: the 14-day relative strength index stands at 41.9, while the average directional index is 11.9, a level TradingView associates with a weak rather than established trend.
The nearest classic pivot above current levels is 1,211, according to TradingView's calculation. If the price moves above that level, traders may look towards the 1,241 pivot as another technical reference. Beyond that, the 1,248 area broadly aligns with the 100-day moving average.
Below the current price, TradingView's classic S1 pivot near 1,160 provides another reference point. A move below that area could shift attention towards lower technical levels, while the 200-day simple moving average near 1,232 remains a separate longer-term marker above the current price (TradingView, 10 August 2026).
This is technical analysis for informational purposes only and does not constitute financial advice or a recommendation to buy or sell any instrument.
National Grid share price history (2024–2026)
NG.’s share price traded at around £9.96 on 12 August 2024, before moving through a variable two-year period shaped by changing interest-rate expectations and regulatory developments. Prices fell to a low near £9.11 on 14 January 2025 before moving higher over the following months.
The stock reached a two-year intraday high of £14.37 on 2 March 2026. The move took place during a period in which UK utility shares were also trading higher. National Grid subsequently moved lower through spring and summer 2026, trading between £11.77 and £13.75. Changes in gilt yields and UK political developments were among the factors affecting sentiment towards the wider utilities sector during this period.
National Grid closed at £11.9170 on 10 August 2026, around 4.1% higher year to date and 13.0% higher than a year earlier.

Past performance is not a reliable indicator of future results. Share prices are indicative and may differ from live market prices.
National Grid (NG.): Capital.com analyst view
National Grid's share price rose from below £10 in mid-2024 to a peak near £14.37 in March 2026 before moving back towards £11.91 by 10 August 2026. Over the same period, the company continued its £70bn network investment programme and announced a series of regulatory and structural developments, including its operating-model simplification on 3 August 2026.
These developments form part of a broader set of factors analysts may consider when assessing National Grid. Its regulated revenue profile and planned network investment sit alongside potential pressures from financing costs, gilt yields, execution risk and regulatory decisions. The relative importance of these factors can change over time.
Analyst views therefore remain mixed. Some published assessments identify the investment programme as a potential source of longer-term growth, while others focus on the costs, execution requirements and regulatory risks associated with delivering it. Broker ratings published during the period ranged from Sell to Overweight, showing that there is no single consensus view on the company's outlook.
Summary – National Grid 2026
- As of 10:07am UTC on 10 August 2026, National Grid traded near £11.91, up roughly 4.1% year to date and 19.6% above its August 2024 level.
- The share price was below its 20/50/100/200-day moving averages, while RSI stood at 41.9 and ADX at 11.9. TradingView associates the latter with relatively weak directional strength.
- Factors that may influence the shares include the £70bn network investment programme, UK regulatory settlements, gilt yield movements and broader utility-sector sentiment.
- Recent developments include National Grid's 3 August 2026 operating-model simplification and analyst price targets ranging from £11.50 to £15.
Past performance is not a reliable indicator of future results.
FAQ
Who owns the most National Grid shares?
This article doesn’t identify National Grid’s largest individual or institutional shareholder, as its focus is on price performance, forecasts, earnings and technical analysis rather than ownership data. Shareholdings can also change over time as investors adjust their positions. Traders researching National Grid may therefore want to consider current regulatory filings or the company’s latest shareholder information alongside the financial, regulatory and market factors discussed in this guide.
What is the five-year National Grid share price forecast?
The forecasts covered in this article extend to 12 months rather than five years. Published targets captured between 20 July and 10 August 2026 ranged from £11.50 to £15, while the two consensus estimates stood at £13 and £13.62. These figures represent analysts’ views at a particular point in time and can change as earnings, regulation, financing conditions and other factors develop. They shouldn’t be treated as guaranteed future prices.
Is National Grid a good stock to buy?
Whether National Grid is suitable depends on an individual’s objectives, circumstances and approach to risk, so this article doesn’t classify the shares as a ‘good’ or ‘bad’ investment. Analysts covered here expressed differing views, with ratings ranging from Sell to Overweight. Factors they may consider include National Grid’s £70bn investment programme, regulated revenue profile, financing costs, gilt yields, execution risks and the regulatory environment. None of these factors determines future performance.
Could National Grid shares go up or down?
Yes. National Grid’s share price can move in either direction as company-specific and wider market conditions change. The article highlights factors such as earnings, regulation, the £70bn network investment programme, financing costs, gilt yields and utility-sector sentiment. Technical indicators can provide additional context, but they don’t predict outcomes with certainty. Analyst price targets also vary, illustrating that different market participants can reach different conclusions from the same available information.
Should I invest in National Grid shares?
This article can’t determine whether you should invest in National Grid. That decision depends on factors such as your objectives, financial circumstances, time horizon and tolerance for risk. The information here instead outlines some of the factors that may affect the shares, including earnings, capital spending, regulation, financing costs and analyst expectations. Historical price performance and third-party forecasts can provide context, but neither can reliably determine how National Grid shares will perform in future.
Can I trade National Grid CFDs on Capital.com?
Yes, you can trade National Grid CFDs on Capital.com. Trading share CFDs lets you speculate on price movements without owning the underlying asset and to take long or short positions. However, contracts for difference (CFDs) are traded on margin, and leverage amplifies both profits and losses. You should ensure you understand how CFD trading works, assess your risk tolerance, and recognise that losses can occur quickly.