
GlaxoSmithKline stock forecast 2025-2050: Third-party GSK price target
GlaxoSmithKline (GSK) is a leading British multinational pharmaceutical and biotechnology company, focused on vaccines, and specialty medicines.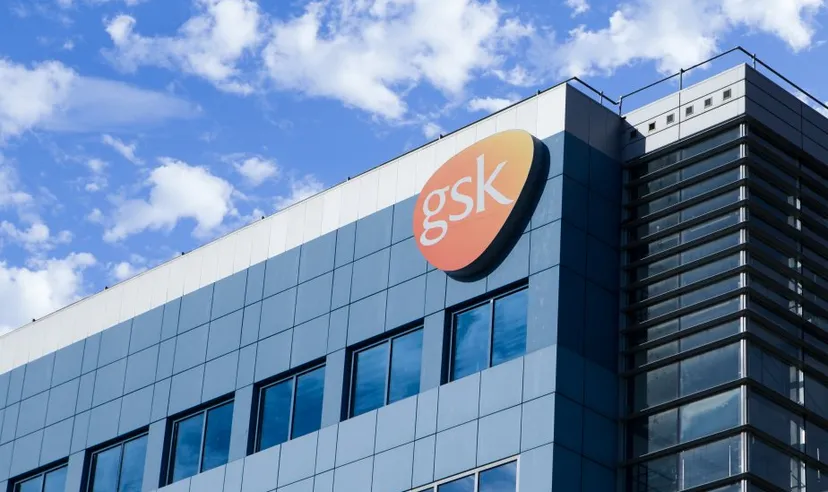
As investor interest in the healthcare sector remains high, what could be next for GSK? This article reviews the latest GlaxoSmithKline stock forecast for 2025 and beyond, drawing on third-party analyst price targets and market perspectives.
Current GSK price and market position
GlaxoSmithKline (GSK) is a leading global biopharmaceutical company, established in 2000 following the merger of Glaxo Wellcome and SmithKline Beecham. GSK’s primary listing is on the London Stock Exchange, and its American Depositary Receipts (ADRs) are traded on the New York Stock Exchange.
In 2025, GSK’s performance has featured new product launches, including its RSV vaccine, Arexvy, and an expanding oncology portfolio supported by recent regulatory approvals.
GSK stock price history
As of 19 August 2025, GSK's share price was $39.62. The stock began the year at $33.94 and stood at $41.52 on the same date in 2024. Over the past ten years, the share price reached a high of $60.31 on 24 January 2020 and a low of $28.47 on 26 December 2022. The 52-week trading range has been $31.72 to $44.67, with a current market capitalisation of $80.5bn.

Past performance is not a reliable indicator of future results. Share prices are indicative and may differ from live market prices.
GlaxoSmithKline stock forecast for 2025 and beyond
As of 20 August 2025, third-party GlaxoSmithKline stock forecasts indicated a broadly neutral outlook for the year ahead. Trading Economics placed its GSK stock price forecast at $38.97 per share by the end of Q3, decreasing to $37.84 over the following 12 months.
Consensus price targets
TipRanks, drawing on the views of 14 analysts, reported a consensus ‘hold’ on GSK’s main London listing, with 12-month price targets averaging 1,577.23 GBX. The range spanned a high of 2,170 GBX and a low of 1,290 GBX, with analyst sentiment divided between ‘hold’, ‘buy’ and ‘sell’ calls.
TradingView’s GSK stock forecast, based on 17 analyst estimates, showed a one-year average target of 1,612.50 GBX, with a consensus ‘neutral’ rating. Targets ranged from a maximum of 2,520 GBX to a minimum of 1,120 GBX. Short-term technical indicators, as reported by TradingView, indicated a ‘sell’ bias as of August.
Algorithmic forecasts
Looking further ahead, CoinCodex noted potential volatility in its GlaxoSmithKline ADR share price prediction, projecting an average GSK price of $39.17 in 2025, within a $36.05-$41.98 range.
CoinCodex’s GlaxoSmithKline share price forecast suggested a move lower through the late 2020s, with the service’s algorithmic models pointing to a decline towards $26.90 in 2027, $25.66 in 2030, and longer-term downside to $12.86 by 2040 and $6.09 by 2050.
Forecasts remain subject to change, and can’t account for unforeseen events. Past performance is not a reliable indicator of future results..
GSK stock price predictions: Analyst outlook
Third-party analysts’ 12-month price targets for GlaxoSmithKline as of 20 August 2025 showed a wide range of outlooks.
-
JP Morgan Cazenove – lowered its GSK price target from 1,460 GBX to 1,400 GBX and reiterated an ‘underweight’ rating (4 August 2025).
-
Deutsche Bank – set a 1,450 GBX price target for GlaxoSmithKline, maintaining its ‘hold’ rating (31 July 2025).
-
Shore Capital – issued a 2,000 GBX price target with a ‘buy’ rating (30 July 2025).
- Barclays – set a 1,450 GBX target for GSK shares, maintaining a ‘hold’ rating (9 July 2025).
Morningstar senior analyst Jay Lee assigned GSK shares a five-star rating and a fair value estimate of 2,200 GBX per local share class and $58 per ADR share. Lee commented: ‘We think shares are deeply undervalued and believe pipeline development and sales momentum from new product launches are the keys to driving share price gains.’
On GSK’s Q2 2025 results, Lee noted: ‘GSK posted 6% year-on-year earnings growth at constant currency and core operating profit margin of 32.9%, or 180 basis points better than the same period last year.’ He added, ‘Growth is driven by recently launched products in its respiratory, immunology, oncology, and HIV portfolios, and continued momentum in specialty medicines is crucial for the stock’s long-term story.’
Third-party predictions can be inaccurate and should only be used as a guide, alongside independent research and technical analysis. Past performance isn’t a reliable indicator of future results.
What could influence GlaxoSmithKline’s share price?
GlaxoSmithKline’s share price is shaped by a mix of internal and external factors, including clinical results, regulatory developments, and market conditions. Here are some of the key elements that could influence the GlaxoSmithKline stock forecast in the coming years.
Pipeline progress and product launches
Successful drug approvals, new indications, and strong launches – particularly in vaccines and selected oncology assets – could support future growth. However, setbacks such as clinical trial failures or regulatory delays may affect GSK stock forecasts, especially when high-profile products are involved.
Regulatory and legal outcomes
Approval decisions from bodies such as the FDA, EMA, or MHRA can influence GSK’s share price moves. Positive news can unlock new revenue streams, while adverse rulings or patent challenges can dampen sentiment. Legal proceedings or potential settlements may also impact investor expectations in GlaxoSmithKline stock forecast scenarios.
Sales performance and market trends
The commercial success of GSK’s current core portfolio – including prescription medicines and vaccines – plays a central role in the GSK stock forecast. Broader industry dynamics, such as generic competition, changes in drug pricing policy, and evolving healthcare spending, can influence demand and margins.
M&A activity and portfolio changes
Strategic acquisitions, partnerships, or divestments may affect GlaxoSmithKline’s share price forecast. While well-executed deals can enhance GSK’s pipeline or reach, integration risks, or overpayment present potential challenges.
Macroeconomic environment and sector shifts
Economic cycles, healthcare budgets, and demographic trends, including ageing populations, influence demand for pharmaceuticals. Currency fluctuations are also relevant – GSK’s international revenues mean a weaker pound can lift reported revenues and earnings, while a stronger British pound (GBP) may have the opposite effect.
Trade GlaxoSmithKline CFDs with Capital.com.
GSK shares trading strategies to consider
Trading GlaxoSmithKline CFDs offers access to various structured approaches, depending on market conditions and individual preference. While strategies differ in complexity, applying basic risk management and using platform tools – such as stop-loss* and take-profit orders – may help manage exposure when trading share CFDs such as GSK.
Here are some common GSK shares trading strategies:
-
Day trading: day traders focus on short-term price movements within a single session, often responding to news, earnings updates, or technical signals.
-
Swing trading: swing traders aim to capture medium-term trends, holding positions for several days to benefit from changes in momentum or sentiment.
-
Trend trading: trend traders seek to follow the prevailing market direction, basing decisions on technical indicators and longer-term charts.
-
Position trading: position traders take a broader perspective, holding positions for weeks or months.
*Please note that stop-loss orders aren’t guaranteed. A guaranteed stop-loss incurs a fee if triggered.
Discover more approaches on our CFD trading strategies page.
FAQ
Where can I buy GSK stock?
You can access GSK shares through the London Stock Exchange (LSE) under the ticker ‘GSK’, or via American Depositary Receipts (ADRs) on the New York Stock Exchange. Major brokers and trading platforms with UK or US market access typically list the stock. You can also trade contracts for difference (CFDs) on the GSK share price.
Is GSK a good stock to buy?
Whether GSK is a suitable addition to your portfolio depends on your trading aims and risk appetite. As of August 2025, third-party analysts’ views on the GlaxoSmithKline stock forecast remained mixed, reflecting a range of price targets and recommendations. Relevant factors include recent drug launches, regulatory updates, and sector trends. Conduct independent research and ensure your decisions align with your investment objectives and risk management approach.
Could GSK rise or fall?
GlaxoSmithKline’s share price can move in response to product approvals, earnings results, industry news, and broader economic shifts. Positive drivers may include successful product launches or strong sales performance, while negative clinical outcomes or regulatory issues could exert downward pressure. Current third-party GlaxoSmithKline stock predictions show a range of possible outcomes, which are subject to change.
Should I trade or invest in GSK?
Trading GSK CFDs may suit those seeking flexibility to respond to short-term price movements, without owning the underlying shares. Investing in GSK shares could appeal if you’re seeking longer-term exposure to the company’s progress and the pharmaceuticals sector. Your decision should reflect your strategy, experience, and risk tolerance.