IonQ stock forecast: Third-party price targets
IonQ is a US-listed quantum computing company that develops quantum hardware and software systems, generating revenue through commercial partnerships, research contracts, and technology deployments. Explore third-party IONQ price targets and technical analysis.
IonQ, Inc. (IONQ) is trading around $35.56 as of 1:49pm UTC on 11 February 2026, fluctuating within an intraday range of $34.65-36.34 on Capital.com’s feed. The current quote sits near the middle of that session range. Past performance is not a reliable indicator of future results.
Price action comes amid heightened attention on IonQ’s acquisition-led expansion strategy and upcoming earnings schedule. The company reported third-quarter 2025 revenue of about $39.9m, up roughly 222% year on year, alongside a net loss of approximately $1.1bn as it scaled investments in quantum hardware and related capabilities (Investing.com, 5 November 2025). Trading also precedes IonQ’s planned release of fourth-quarter and full-year 2025 results on 25 February 2026 (Financial Times, 4 February 2026).
IonQ stock forecast 2026–2030: Third-party price targets
As of 11 February 2026, third-party IonQ stock predictions show a wide 12-month range, reflecting differing assessments of the company’s growth trajectory, path to profitability, and integration of recent acquisitions. The following briefings summarise selected third-party targets and the context cited in dated public sources from this period.
Zacks / broader analyst sample (average upside indication)
Zacks reports that short-term price forecasts from 12 analysts imply an average upside of 74.61% from a last closing price of $43.24, based on their compiled target set. The note places this outlook within a late-January rebound in quantum-computing shares, as analysts weigh IonQ’s announced $1.8bn SkyWater acquisition against ongoing losses and execution risks (Yahoo Finance, 2 February 2026).
MarketBeat (consensus snapshot)
MarketBeat states that IonQ carries an average 12-month price target of about $75.91, with individual analyst objectives reaching as high as $100. The service notes that this 'Moderate Buy' consensus combines nine Buy, six Hold, and one Sell rating, aggregating broker research published after recent earnings and deal announcements (MarketBeat, 9 February 2026).
Benzinga (aggregated broker data)
Benzinga reports that its consensus IONQ stock forecast stands near $68.67, derived from 16 analyst price objectives in its database. The data provider highlights a range from roughly $30 at the low end to $100 at the high end, as analysts adjust their models amid volatility in high-growth technology names (Benzinga, 6 February 2026).
Rosenblatt Securities (broker research)
Rosenblatt Securities reiterates a Buy rating on IonQ and issued a $100 12-month price target. The firm identifies revenue expansion and IonQ’s position in quantum computing as key considerations, while acknowledging that the target sits materially above recent trading levels (MarketBeat, 6 February 2026).
Predictions and third-party forecasts are inherently uncertain, as they cannot fully account for unexpected market developments. Past performance is not a reliable indicator of future results.
IONQ stock price: Technical overview
The IONQ stock price trades near $35.56 as of 1:49pm UTC on 11 February 2026, positioned below a broad moving-average cluster, with the 20/50/100/200-day SMAs around 43, 47, 54 and 47 respectively. The 14-day RSI, near 36, sits in lower-neutral territory, while an ADX reading around 30 signals an established trend backdrop rather than a sideways market.
On the topside, the nearest classic resistance appears around 49 (R1), with the 59 area (R3) coming into view only after a sustained daily close above that initial pivot zone. On pullbacks, the classic pivot near 44 marks an initial reference level, while the 100-day SMA around 54 acts as a longer-term reference zone. A clear move below nearby support levels could bring the S1 region around 35 into focus (TradingView, 11 February 2026).
This technical analysis is for informational purposes only and does not constitute financial advice or a recommendation to buy or sell any instrument.
IonQ share price history (2024–2026)
IONQ’s stock price has shifted markedly over the past two years, moving from a single-digit stock into a more volatile growth name. The shares traded below $10 through much of mid-2024, then accelerated into late 2024 and 2025, with notable swings around earnings and corporate announcements. From a close near $8.79 on 13 May 2024, the price rose to $41.30 by 31 December 2024, before extending gains and then reversing sharply in late 2025.
In 2025, price action featured a rally into the autumn followed by a pronounced pullback into early 2026. The shares rose from about $22.29 on 31 March 2025 to a peak above $80 in mid-October, before retreating toward the mid-$40s by year-end and then into the mid-$30s by 11 February 2026, when they closed at $35.67. The stock therefore remains above early-2024 levels, but below the highs reached during the 2025 rally, as volatility has increased.
Past performance is not a reliable indicator of future results. Share prices are indicative and may differ from live market prices.
IonQ (IONQ): Capital.com analyst view
IonQ’s share price has moved from single digits in early 2024 into a volatile trading range, with rallies followed by rapid reversals as market participants assess its quantum-computing strategy and acquisition activity. The pullback from the October 2025 highs coincided with profit-taking in some high-growth technology names and renewed focus on valuation metrics. Even so, the stock continues to trade above mid-2024 levels, illustrating how sentiment can shift in both directions.
News flow around IonQ’s $1.8bn agreement to acquire chipmaker SkyWater and other transactions has supported discussion of a 'full-stack' quantum strategy, while also raising questions about dilution, execution risk, and the impact of short-seller scrutiny. Strong revenue growth has featured in more constructive assessments, while more cautious commentary highlights ongoing losses, reliance on equity funding, and the possibility that weaker-than-expected earnings or integration challenges could weigh on the share price.
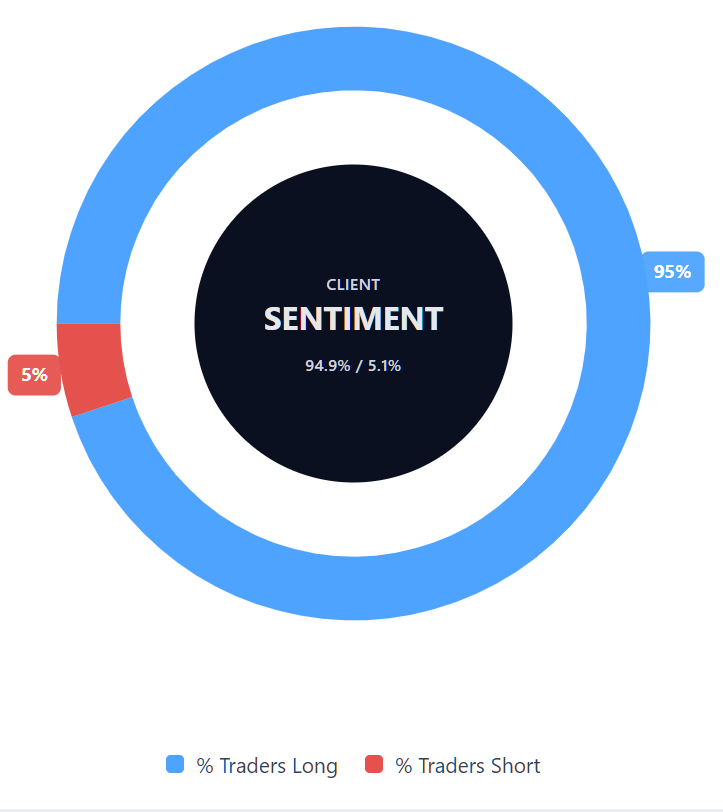
Capital.com’s client sentiment for IonQ CFDs
As of 11 February 2026, Capital.com client positioning in IonQ CFDs currently shows a pronounced skew towards long positions, with buyers at 94.9% and sellers at 5.1%, placing buyers ahead by roughly 89.7 percentage points. This distribution reflects open positions on the platform at the time of writing and can change as market conditions evolve.
Summary – IonQ 2026
- IonQ (IONQ) is quoted around $35.56 as of 1:49pm UTC on 11 February 2026, trading within an intraday range of $34.65-36.34 on Capital.com’s feed.
- Over the past two years, the share price has moved from single digits in early 2024 to a peak above $80 in October 2025, before retreating towards the mid-$30s by February 2026 as volatility increased.
- Technical readings show the price below the 20/50/100/200-day moving-average cluster, with a 14-day RSI near 36 and ADX near 30 indicating a weaker phase within an established trend backdrop.
- Recent developments include the proposed $1.8bn SkyWater acquisition, continued revenue growth, and debate around dilution, losses, and short-seller scrutiny. As with all equities, forecasts and price targets remain subject to change, and CFD traders should consider both potential opportunities and the risks associated with volatility and leverage.
Past performance is not a reliable indicator of future results.
FAQ
Who owns the most IonQ stock?
What is the 5-year IonQ share price forecast?
Is IonQ a good stock to buy?
Could IonQ stock go up or down?
Should I invest in IonQ stock?
Can I trade IonQ CFDs on Capital.com?
Yes, you can trade IonQ CFDs on Capital.com. Trading share CFDs lets you speculate on price movements without owning the underlying asset and to take long or short positions. However, contracts for difference (CFDs) are traded on margin, and leverage amplifies both profits and losses. You should ensure you understand how CFD trading works, assess your risk tolerance, and recognise that losses can occur quickly.