Intesa Sanpaolo stock forecast: Middle East tensions, ECB hold
Intesa Sanpaolo is an Italian bank listed in Milan; ISP shares pulled back as the STOXX 600 Banks fell 7% amid Middle East tensions, despite record 2025 profit and a July 2026 buyback. Past performance is not a reliable indicator of future results. Explore third-party ISP price targets.
Intesa Sanpaolo S.p.A. (ISP) is trading at €5.31 as of 2:35pm UTC on 11 March 2026, within an intraday range of €5.265–€5.405. Past performance is not a reliable indicator of future results.
The stock has faced pressure alongside the broader European banking sector, which recorded its steepest two-session decline since April 2025 as conflict in the Middle East intensified, with the STOXX 600 Banks index falling more than 7% over that period (Reuters, 3 March 2026). At the same time, the ECB held its deposit rate at 2.0% at its 5 February 2026 meeting (European Central Bank, 5 February 2026). Intesa Sanpaolo itself reported record full-year 2025 net income of €9.3 billion, up 7.6% year on year, and outlined a 2026–2029 plan targeting approximately €10 billion in net income for 2026, alongside a 95% payout ratio that includes a €2.3 billion share buyback commencing in July 2026 (Intesa Sanpaulo, 2 February 2026).
Intesa Sanpaolo stock forecast 2026–2030: Third-party price targets
As of 11 March 2026, third-party Intesa Sanpaolo stock predictions reflect a broadly constructive stance on the stock, shaped by the bank's record 2025 earnings, its shareholder distribution programme, and the Eurozone rate environment. The following mini-briefs summarise leading third-party assessments published in February or March 2026.
Investing.com (consensus overview)
Investing.com aggregates 19 analyst forecasts for ISP and returns a buy consensus, with an average 12-month price target of €5.46, a high estimate of €6.20, and a low of €4.50. Contributing analysts broadly cite the bank's strong capital generation and payout commitments, while the dispersion between the high and low estimates reflects differing assumptions around Eurozone net interest income trajectories (Investing.com, 9 March 2026).
MarketScreener (multi-broker consensus)
MarketScreener tracks 21 analysts covering ISP and records a mean outperform consensus, with an average 12-month target of €6.59, a high of €7.30, and a low of €4.50. Contributing brokers, including UBS, Barclays, JPMorgan, Goldman Sachs, and Morgan Stanley, cite Intesa Sanpaolo's guided 95% payout ratio and its €2.3 billion buyback programme commencing in July 2026 as primary supports for the premium implied by the mean target (MarketScreener, 11 February 2026).
Reuters (post-results analyst reaction)
Reuters reports that analysts reacted constructively to ISP's full-year 2025 results, with the bank guiding toward approximately €10 billion in net income for 2026 alongside a return on equity above 20% by 2029. Analysts noted the bank's hedging strategy on net interest margin as a buffer against ECB easing, while the guided profit trajectory underpins the constructive ratings held across the broker community (Reuters, 2 February 2026).
Yahoo Finance (aggregated broker targets)
Yahoo Finance aggregates broker ISP stock forecasts and reflects an analyst mean price target in the mid-to-upper €6 range, with the broad spread of individual estimates illustrating meaningful variation around the central case. Analysts flagged in the aggregation note Intesa Sanpaolo's total shareholder distribution of approximately €8.8 billion across the 2026–2029 plan period as a key anchor for current valuation multiples, amid a stable but decelerating Eurozone rate environment (Yahoo Finance, 7 March 2026).
MarketBeat (individual broker targets)
MarketBeat tracks individual broker price targets for Intesa Sanpaolo and notes that recent updates from major houses, including JPMorgan's target lift to €6.50, sit comfortably above the current trading level of €5.31. Analysts cite the bank's progress on cloud-based IT infrastructure and its sixth consecutive Best Investment Bank Italy award from Global Finance as supplementary factors supporting the higher-rated cluster (MarketBeat, 3 March 2026).
Predictions and third-party forecasts are inherently uncertain, as they cannot fully account for unexpected market developments. Past performance is not a reliable indicator of future results.
ISP stock price: Technical overview
The ISP stock price is trading at €5.31 at 2:35pm UTC on 11 March 2026, sitting below a dense moving-average shelf where the 20/50/100/200-day SMAs converge between approximately €5.47 and €5.81, with all four averages aligned in a sell configuration against the current price. The 200-day EMA at €5.42 and the 10-day EMA at €5.43 run closest to price, forming an immediate overhead ceiling just above the intraday high of €5.405.
Momentum is soft but not deeply oversold: the 14-day RSI stands at 37.9, in lower-neutral territory, while the ADX at 29.5 signals an established rather than exhausted trend, indicating the prevailing downward pressure retains some structure. The MACD at -0.156 and momentum at -0.482 both lean negative, consistent with the broader sell reading from the MA cluster.
To the topside, classic R1 at €6.13 is the first meaningful reference; a sustained daily close back above the 200-day SMA near €5.47 would be a prerequisite before that level comes into view. Beyond R1, classic R2 at €6.42 represents the next area of interest if price were to recover above the MA shelf on a convincing basis.
On the downside, the classic pivot at €5.87 now acts as overhead resistance rather than support given price is trading below it. Initial support rests at classic S1 near €5.57, with the next reference at S2 around €5.31 – broadly the current trading level. Losing S2 on a closing basis would bring classic S3 near €4.75 into the picture as the next structured reference to the downside (TradingView, 11 March 2026).
This is technical analysis for informational purposes only and does not constitute financial advice or a recommendation to buy or sell any instrument.
Intesa Sanpaolo share price history (2024–2026)
ISP’s stock price opened March 2024 around €3.10 and spent much of the first half of the year in a steady grind higher, climbing from €3.14 on 12 March 2024 to close at €3.76 at the end of August 2024, as Eurozone sentiment and strong Italian banking earnings underpinned demand.
The rally gathered pace in late 2024. ISP pushed through €3.90 in October, briefly touched €4.15 in early November before pulling back sharply after post-US-election volatility, then recovered to close the year at €3.87 on 30 December 2024 – up roughly 23% over 2024.
Momentum accelerated into 2025. The stock broke above €4 in late January, crossed €4.50 in April, then hit a short-term low of €3.87 on 9 April amid a broad European equity sell-off, before recovering strongly. By mid-November 2025, ISP was testing €6, closing at €5.99 on 13 November 2025 – its highest level in the dataset.
A gradual pullback followed into year-end, with ISP closing 2025 at €5.95 on 30 December. The stock has continued lower into 2026, retreating from a February high of €6.17 on 4 February 2026 to trade at €5.31 on 11 March 2026 – approximately 10.8% down from that peak, though still up roughly 37% compared with 11 March 2025 (€4.69).
Past performance is not a reliable indicator of future results. Share prices are indicative and may differ from live market prices.
Intesa Sanpaolo (ISP): Capital.com analyst view
Intesa Sanpaolo's share price has posted a substantial two-year recovery, rising from around €3.14 in March 2024 to a dataset high near €6.17 in early February 2026, before retreating to €5.31 by 11 March 2026. This advance coincided with a run of improved reported profitability, culminating in record full-year 2025 net income of €9.3 billion and a 2026–2029 plan targeting approximately €10 billion in net income for 2026, alongside a €2.3 billion buyback and a 95% payout ratio. Some market participants may view this capital return programme and the bank's guided net interest income growth to €16.3 billion by 2029 as supportive of the current valuation; others may note that the stock's re-rating leaves it more exposed to any shortfall in execution, a faster-than-expected ECB easing cycle, or a deterioration in Italian sovereign credit conditions.
The ECB's rate path remains a key variable in either direction. Scope Ratings projects Eurozone bank NII growth of around 0.6% in 2026 and 1.7% in 2027 under a stable Euribor scenario, which could support margins if rates hold near current levels; conversely, accelerated easing or a weaker Italian GDP environment – Intesa Sanpaolo's own plan assumes average real GDP growth of approximately 0.7% per year in Italy across 2026–2029 – could compress earnings estimates and weigh on the share price. Broader European banking sentiment, geopolitical developments, and any change in regulatory capital requirements add further uncertainty to the near-term picture.
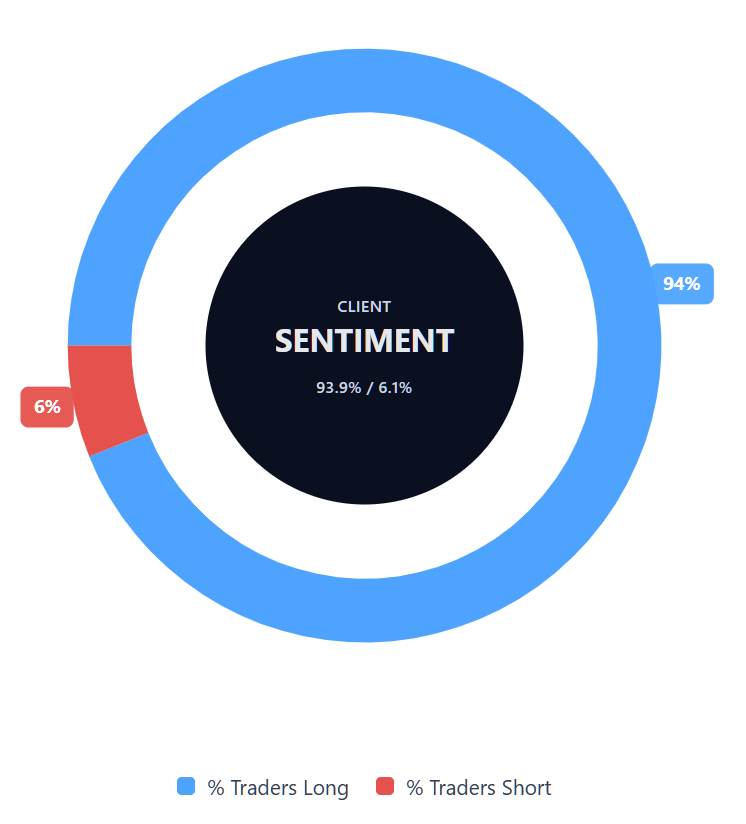
Capital.com’s client sentiment for Intesa Sanpaolo CFDs
As of 11 March 2026, Capital.com client positioning in Intesa Sanpaolo CFDs shows 93.9% buyers vs 6.1% sellers, putting buyers ahead by 87.8 pp and placing sentiment firmly in high-long, one-sided territory. This snapshot reflects open positions on Capital.com at the time of capture and can change as market conditions evolve.
Summary – Intesa Sanpaolo 2026
- ISP is trading at €5.31 as of 2:35pm UTC on 11 March 2026, down from a dataset high of €6.17 on 4 February 2026, but up roughly 37% year on year.
- Price has trended strongly higher from around €3.14 in March 2024, gaining through 2024 and 2025 before pulling back in February and March 2026.
- All key moving averages sit above current price in a sell alignment; the 14-day RSI at 37.9 is lower-neutral, while ADX at 29.5 indicates the downtrend retains structure.
- Classic pivot support sits near €5.57 (S1), with the current level broadly coinciding with S2 at €5.31; a close below S2 would bring €4.75 into focus.
- Record full-year 2025 net income of €9.3 billion and a 2026–2029 plan targeting approximately €10 billion of net income for 2026 underpin the constructive broker consensus.
Past performance is not a reliable indicator of future results.
FAQ
Who owns the most Intesa Sanpaolo stock?
What is the 5 year Intesa Sanpaolo share price forecast?
Is Intesa Sanpaolo a good stock to buy?
Could Intesa Sanpaolo stock go up or down?
Should I invest in Intesa Sanpaolo stock?
Can I trade Intesa Sanpaolo CFDs on Capital.com?
Yes, you can trade Intesa Sanpaolo CFDs on Capital.com. Trading share CFDs lets you speculate on price movements without owning the underlying asset and to take long or short positions. However, contracts for difference (CFDs) are traded on margin, and leverage amplifies both profits and losses. You should ensure you understand how CFD trading works, assess your risk tolerance, and recognise that losses can occur quickly.