Intel stock forecast: 18A rollout
Intel is advancing its 18A process node and rolling out Core Ultra 200S Plus and mobile chips. Past performance is not a reliable indicator of future results. Explore third-party INTC price targets and technicals.
Intel Corporation (INTC) is trading at $44.34 as of 3:21pm UTC on 18 March 2026, within an intraday range of $43.67–$46.55. Past performance is not a reliable indicator of future results.
Intel-specific newsflow continues to centre on the rollout of its Core Ultra 200S Plus and mobile chips built on the 18A process node, as the company advances its ‘Foundry First’ strategy, while Wall Street maintains a consensus hold rating on the stock (Intel, 11 March 2026).
Intel stock forecast 2026–2030: Third-party price targets
As of 18 March 2026, third-party Intel stock predictions remain cautious and focus on the company’s ability to execute its foundry transition and recover server CPU market share. The following summaries draw on consensus data and broker-aggregated figures published between 10 and 18 March 2026.
MarketBeat (consensus rating and target)
MarketBeat aggregates ratings from 37 Wall Street analysts covering Intel and reports a consensus rating of Reduce alongside an average 12-month INTC stock forecast of $45.74. The 50-day moving average stands at $46.48 and the 200-day moving average at $39.15, reflecting the stock’s substantial recovery over the prior year, while the analyst community broadly continues to wait for clearer foundry execution signals before making further upgrades (MarketBeat, 17 March 2026).
Public.com (analyst panel)
Public.com surveys 30 analysts and arrives at a consensus Hold rating with a price target of $43.67. The breakdown shows 13% Strong Buy, 7% Buy, 70% Hold, 7% Sell, and 3% Strong Sell, with analysts citing ongoing losses in the Intel Foundry segment and elevated capital expenditure as the primary drags on near-term sentiment (Public.com, 16 March 2026).
Barchart (year-ahead outlook)
Barchart reports that, after a strong rally in 2025, analyst debate for 2026 centres on whether INTC can double from its recovered base, with views split between those citing AI-server tailwinds and those pointing to unresolved foundry profitability. Aggregate price targets cited in the piece sit within a range broadly consistent with the $43–$52 band visible across institutional consensus platforms (Yahoo Finance, 13 March 2026).
MarketBeat (intraday move note)
MarketBeat reports INTC up 2.6%, with the consensus price target of $45.74 and a Reduce rating unchanged across the analyst panel as of that date. The note highlights that the stock’s 50-day moving average continues to act as a reference level, with no new broker initiations or target changes recorded in that session (MarketBeat, 11 March 2026).
Predictions and third-party forecasts are inherently uncertain, as they cannot fully account for unexpected market developments. Past performance is not a reliable indicator of future results.
INTC stock price: Technical overview
The INTC stock price was $44.34 at 3.21pm UTC on 18 March 2026, according to TradingView data, well above its entire moving-average stack. The 20/50/100/200-day SMAs were approximately $18 / $22 / $25 / $24. On TradingView’s daily timeframe, these indicators were marked as ‘sell’ signals, which may reflect a moving-average panel calibrated to a prior price range rather than the current quote. The 14-day RSI at 35.59 was in the lower reaches of neutral territory, while the average directional index (14) at 42.47 indicated that a trend was in force.
On the topside, the nearest classic resistance reference was R1 at $21.64. TradingView also showed R2 at $25.53 as the next classic resistance level. The Woodie R1 at $20.17 and the DM R1 at $20.56 broadly corroborate that $20-$22 band as the first meaningful pivot zone above the current MA cluster.
On pullbacks, the classic pivot point at $19.48 provides the initial support reference, with the Fibonacci and Woodie pivots converging near $18.74-$19.48 to reinforce that shelf. TradingView listed S1 at $15.59 as the next support reference below that area, while S2 near $13.43 was identified as the next lower support level (TradingView, 18 March 2026).
This is technical analysis for informational purposes only and does not constitute financial advice or a recommendation to buy or sell any instrument.
Intel share price history (2024–2026)
INTC’s stock price traded near $42–$44 in March 2024, but a sharp sell-off through Q2 dragged the stock below $32 by late April. The decline continued through the summer, with INTC touching a multi-year low close of $18.88 on 6 September 2024, as the company reported disappointing earnings and announced sweeping cost-reduction measures, including significant workforce cuts.
INTC ended 2024 at $20.05, then gradually recovered ground through early 2025, reaching $27.59 on 18 February before pulling back again. The stock dipped as low as $19.91 in March 2025 amid renewed concerns over competitive pressure from AMD and the pace of Intel’s foundry turnaround, before closing at $26 on 18 March 2025.
The second half of 2025 brought renewed momentum. INTC climbed to $30.58 on 18 September 2025, then accelerated sharply into January 2026, reaching an intraday peak of $55.05 and a close of $54.95 on 21 January 2026, its highest level since early 2022, following Q4 earnings and positive sentiment around its 18A process node. The stock has since pulled back, closing at $44.43 on 18 March 2026, approximately 12.3% up year to date and 70.9% up year on year.
Past performance is not a reliable indicator of future results. Share prices are indicative and may differ from live market prices.
Intel (INTC): Capital.com analyst view
Intel’s recovery from its 2024 lows has been one of the more notable stories in the semiconductor space, with INTC reclaiming ground above $44 after bottoming near $18 in September 2024. The rebound reflects improved confidence in the company’s foundry strategy and its 18A process node rollout, alongside broader optimism around AI-driven chip demand. That said, Intel continues to face meaningful headwinds. AMD and Nvidia retain strong competitive positioning in server and AI accelerator markets, and Intel Foundry remains loss-making, so execution risk remains.
The stock’s sharp pullback from its January 2026 peak near $55 to current levels around $44 illustrates how quickly sentiment can shift when expectations outpace delivery. Analysts broadly hold a neutral stance, with consensus price targets clustering near current trading levels, suggesting the market is waiting for firmer evidence of foundry customer wins and margin improvement before assigning a higher valuation to the stock. At the same time, any positive catalyst, such as a significant external foundry agreement or stronger-than-expected earnings, could support renewed interest in the shares. Equally, weaker execution or softer demand could keep sentiment restrained.
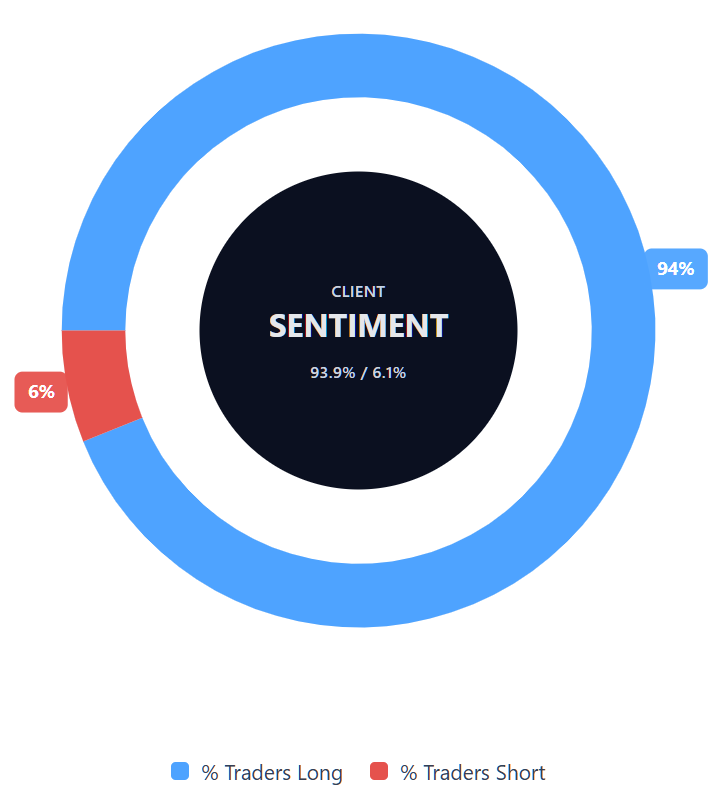
Capital.com’s client sentiment for Intel CFDs
As of 18 March 2026, Capital.com client positioning in Intel CFDs shows 93.9% buyers and 6.1% sellers, which places the stock firmly in heavy-buy territory, with buyers ahead by 87.8 percentage points. This snapshot reflects open positions on Capital.com and can change.
Summary – Intel 2026
- Intel (INTC) trades at $44.34 as of 3:21pm UTC on 18 March 2026, up roughly 70.9% year on year from $26 on 18 March 2025.
- Technical indicators are broadly negative, with the full moving-average stack above current pivot levels pointing to sell signals, while the 14-day RSI sits at 35.59 in lower-neutral territory.
- The average directional index (14) at 42.47 confirms an established trend is in force, while classic pivot support sits at $19.48 and R1 resistance at $21.64.
- Key drivers include Intel’s 18A foundry ramp, AI-server chip demand, competitive pressure from AMD and Nvidia, and the Federal Reserve’s rate decision on 18 March 2026.
- Recent newsflow centres on Intel’s ‘Foundry First’ strategy, Core Ultra 200S chip launches, ongoing foundry losses, and a broader semiconductor sector rally tied to AI infrastructure spending.
Past performance is not a reliable indicator of future results.
FAQ
Who owns the most Intel stock?
What is the 5 year Intel share price forecast?
Is Intel a good stock to buy?
Could Intel stock go up or down?
Should I invest in Intel stock?
Can I trade Intel CFDs on Capital.com?
Yes, you can trade Intel CFDs on Capital.com. Trading share CFDs lets you speculate on price movements without owning the underlying asset and to take long or short positions. However, contracts for difference (CFDs) are traded on margin, and leverage amplifies both profits and losses. You should ensure you understand how CFD trading works, assess your risk tolerance, and recognise that losses can occur quickly.