HENSOLDT stock forecast: Ukraine service centre launch
HENSOLDT is a German defence electronics company, with April 2026 trading shaped by geopolitical headlines, a record 2025 order backlog and guidance for revenue of about €2,750 million. Past performance is not a reliable indicator of future results. Explore third-party HAG price targets.
HENSOLDT AG (HAG) is trading at €82.745 as of 3:26pm UTC on 8 April 2026, according to Capital.com's quote feed, within an intraday range of €79.38–€82.95. Past performance is not a reliable indicator of future results.
Price action reflects several converging drivers. HENSOLDT opened April with notable volatility, as shares swung on geopolitical headlines, with a mid-week defence sector recovery – tied to diplomatic hopes around the Iran conflict – giving way to profit-taking into the Easter holiday weekend (AD HOC NEWS, 5 April 2026). Underlying demand signals remain firm: HENSOLDT reported full-year 2025 order intake of €4,710 million, up 62% year on year, and an order backlog of €8,833 million, with 2026 revenue guidance of approximately €2,750 million and an adjusted EBITDA margin target of 18.5%–19.0% (HENSOLDT, 26 February 2026). Since 1 April 2026, the company has also been operating a new innovation and service centre in Ukraine to support active TRML-4D radar deployments, feeding operational data back into sensor development (The Defense Post, 1 April 2026).
HENSOLDT stock forecast 2026–2030: Third-party price targets
As of 8 April 2026, third-party HENSOLDT stock predictions reflect a range of views shaped by European rearmament demand, order backlog execution, free cash flow visibility, and near-term margin delivery. The following summaries draw on broker notes and consensus data issued during that period.
J.P. Morgan (Neutral reiteration)
J.P. Morgan analyst David H Perry reiterates a Neutral rating on HENSOLDT with a 12-month HAG stock forecast of €85, trimmed from €90. Perry maintains a cautious stance amid uncertainty over near-term margin execution, with the 2026 adjusted EBITDA guidance range of 18.5%–19.0% viewed as leaving limited room for disappointment (MarketScreener, 7 April 2026).
Kepler Cheuvreux (upgrade to Hold)
Kepler Cheuvreux upgrades HENSOLDT to Hold from Reduce and raises its 12-month price target to €81, reflecting a more balanced risk/reward view following sector-wide volatility. The revision comes after a recalibration of European defence valuations tied to geopolitical developments, with the new target acknowledging improved entry levels while flagging continued execution risk (TipRanks, 16 March 2026).
Jefferies (upgrade to Buy)
Jefferies analyst Chloe Lemarie upgrades HAG to Buy from Hold and sets a 12-month price target of €90, citing a sustained influx of German defence orders and what she considers conservative free cash flow guidance for 2026. Lemarie notes that the lower share valuation at the time of the upgrade offered an improved entry point, with the company's approximately €48 billion proposal pipeline providing near-term order visibility (The Globe and Mail, 9 March 2026).
MarketScreener (broker consensus)
MarketScreener aggregates estimates from 14 analysts, arriving at an average 12-month price target of €91.14, with a high estimate of €114 and an overall consensus rating of Outperform, as of 25 March 2026. The range of individual targets reflects differing assumptions around margin delivery, order conversion, and the pace of German and broader European defence procurement (MarketScreener, 25 March 2026).
Predictions and third-party forecasts are inherently uncertain, as they cannot fully account for unexpected market developments. Past performance is not a reliable indicator of future results.
HAG stock price: Technical overview
The HAG stock price trades at €82.745 as of 3:26pm UTC on 8 April 2026, sitting above every standard moving average in the 10–200-day range, with the exception of the 200-day simple moving average (SMA) at €87 and the Hull moving average (9) at €86, both of which register sell signals on TradingView's summary. The 20-, 50-, 100- and 200-day SMAs sit at €77, €79, €79 and €87 respectively, and the price currently holds above the 10-to-100-day cluster, a positioning consistent with a 20-over-50 buy alignment in the SMA family.
Momentum sits in upper-neutral territory: the 14-day relative strength index (RSI) reads 57.10, a level TradingView classifies as neutral, while the average directional index (ADX) at 16.91 falls below the 25 threshold, suggesting the current move does not yet reflect a strongly trending environment. The MACD level (12, 26) of 0.34 and the awesome oscillator at 1.64 both carry buy signals, lending a firmer tone to shorter-term momentum without confirming a decisive directional shift.
On the topside, the classic R1 pivot at €85.23 is the nearest overhead reference above the last price; a daily close through that level could bring the R2 area at €94.87 into broader view. On pullbacks, the classic pivot point at €75.72 represents the initial support reference on TradingView's pivot framework, with the 100-day SMA shelf near €78.53 sitting between the current price and that pivot as an intermediate level. A move below that MA shelf would place greater focus on S1 at €66 on the classic pivot table (TradingView, 8 April 2026).
This is technical analysis for informational purposes only and does not constitute financial advice or a recommendation to buy or sell any instrument.
HENSOLDT share price history (2024–2026)
HAG’s stock price traded around €28–€39 during April–September 2024, based on the provided price data, before embarking on a sustained rally through the second half of 2024 and into 2025.
The stock climbed sharply through mid-2025, reaching a dataset peak close of €105.71 on 13 October 2025, with an intraday high of €117.82 recorded on 6 October 2025. That represented a gain of approximately 273% from the late-September 2024 close of around €28.32, during a period marked by rising European defence spending commitments. From that October 2025 peak, HAG then pulled back materially, falling to a close of €56.54 on 7 April 2026, with an intraday low of €45.24, marking a drawdown of around 46.5% from the high.
HAG closed 2025 at €73.525 on 30 December, then opened 2026 at €76.63 on 2 January, touching a year-to-date high of €97.10 on 19 January before retreating. A renewed sell-off through late March 2026 brought the stock back to a close of €71.43 on 30 March, before recovering towards current levels.
HAG closed at €83.145 on 8 April 2026, approximately 8.5% up year to date and 47.1% up year on year.
Past performance is not a reliable indicator of future results. Share prices are indicative and may differ from live market prices.
HENSOLDT (HAG): Capital.com analyst view
HENSOLDT's share price trajectory over the past two years reflects the broader rise in European defence spending, with the stock climbing from the mid-€20s in mid-2024 to an intraday high above €117 in October 2025 before giving back a substantial portion of those gains. The structural case rests on Germany's expanding procurement budget, the EU's SAFE rearmament initiative, and a record order backlog of €8.83 billion, all of which may support revenue visibility through the end of the decade. Against that, HENSOLDT entered 2026 in what BofA Securities described as a 'transition year', with 2026 revenue guidance of approximately €2.75 billion sitting slightly below some external consensus estimates and ongoing SAP implementation costs expected to weigh through 2029.
The stock has recovered from a sharp late-March 2026 sell-off, with the current level of €82.745 representing a partial rebound. European rearmament momentum and a deepening order pipeline remain important considerations; however, execution risk around margin delivery, supply-chain constraints that weighed on Q4 2025 revenue, and the broader sensitivity of defence sector valuations to geopolitical de-escalation headlines could all introduce further volatility in either direction.
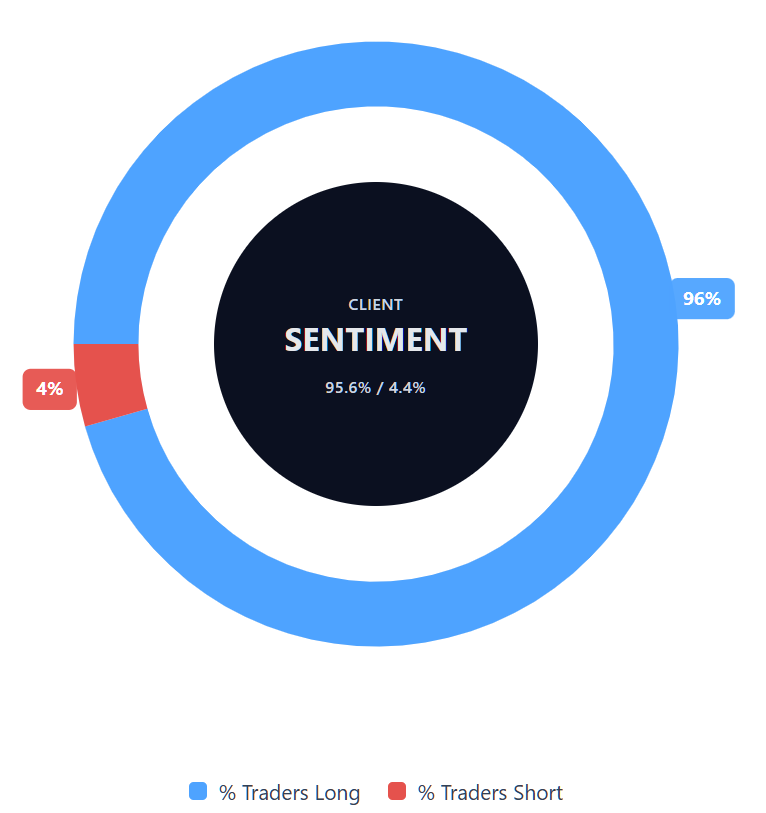
Capital.com’s client sentiment for HENSOLDT CFDs
As of 8 April 2026, Capital.com client positioning in HENSOLDT CFDs stands at 95.6% buyers vs 4.4% sellers, putting buyers ahead by 91.2 percentage points and placing sentiment firmly in long-biased territory. This snapshot reflects open positions on Capital.com at the time of writing and can change rapidly as market conditions evolve.
Summary – HENSOLDT 2026
- HENSOLDT (HAG) trades at €82.745 as of 3:26pm UTC on 8 April 2026, up approximately 8.5% year to date and 47.1% year on year.
- Key drivers include European rearmament spending, Germany's expanding defence budget, and HENSOLDT's record 2025 order backlog of €8.83 billion and raised 2026 revenue guidance.
- Risks include near-term margin execution uncertainty, SAP implementation costs through 2029, supply-chain constraints, and sensitivity to geopolitical de-escalation headlines.
Past performance is not a reliable indicator of future results.
FAQ
Who owns the most HENSOLDT stock?
What is the 5 year HENSOLDT share price forecast?
Is HENSOLDT a good stock to buy?
Could HENSOLDT stock go up or down?
HENSOLDT stock could move in either direction, depending on how company-specific and sector-wide factors develop. Supportive drivers may include further contract wins, steady backlog conversion and continued defence budget growth across Europe. On the other hand, weaker margin delivery, operational delays, supply-chain disruption or geopolitical de-escalation could weigh on sentiment. Technical levels may also influence shorter-term price action, but they do not guarantee future performance or define the stock’s longer-term direction.
Should I invest in HENSOLDT stock?
Can I trade HENSOLDT CFDs on Capital.com?
Yes, you can trade HENSOLDT CFDs on Capital.com. Trading share CFDs lets you speculate on price movements without owning the underlying asset and to take long or short positions. However, contracts for difference (CFDs) are traded on margin, and leverage amplifies both profits and losses. You should ensure you understand how CFD trading works, assess your risk tolerance, and recognise that losses can occur quickly.