Stellantis stock forecast: Q1 results, Microsoft AI pact
Stellantis is a multinational carmaker due to report Q1 2026 results on 30 April, after announcing a five-year AI collaboration with Microsoft on 16 April 2026. Explore third-party STLAM price targets and technical analysis. Past performance is not a reliable indicator of future results.
Stellantis N.V. (STLAM) is trading at €7.51 in early European trading as of 9:59am UTC on 21 April 2026, having touched the top of its intraday range of €7.19–€7.51.
Sentiment around the stock is shaped by several concurrent developments. Stellantis confirmed on 17 April 2026 that it will release its Q1 2026 financial results on 30 April, keeping near-term earnings expectations in focus (The Globe and Mail, 18 April 2026). On 16 April, the company announced a five-year strategic collaboration with Microsoft to co-develop more than 100 AI initiatives across sales, customer care and operations, including AI-powered product development and predictive maintenance (Stellantis, 16 April 2026). The broader European auto sector also recorded a sharp rise in EV demand, with battery-electric vehicle registrations across major European markets up 29.4% year on year in Q1 2026, according to data reported by Reuters on 20 April (Reuters, 20 April 2026). At the same time, ongoing EU–US tariff uncertainty continues to weigh on European carmaker valuations more broadly (Automotive Logistics, 19 January 2026).
Stellantis stock forecast 2026–2030: Third-party price targets
As of 21 April 2026, third-party Stellantis stock predictions reflect a cautious but tentatively stabilising consensus, with most EUR-denominated individual targets clustering in the €6–€7.50 range amid the group's ongoing restructuring, negative free cash flow guidance for 2026 and persistent US tariff exposure.
Morgan Stanley (individual broker view)
Morgan Stanley analyst Javier Martinez de Olcoz Cerdan trimmed the 12-month price target on Stellantis to €6 from €7, while retaining an Equal Weight rating, after the firm lowered its margin and earnings expectations to reflect the reset in the group's 2026 operating outlook following front-loaded charges. The revision incorporates reduced adjusted operating income projections amid what Morgan Stanley describes as a complex multi-year recovery path (Yahoo Finance, 1 April 2026).
Citi (individual broker view)
Citi analyst Harald Hendrikse raised the 12-month price target on Stellantis to €7.50 from €7, while upgrading the rating to Buy, citing early signs of a potential shift in investor sentiment after the stock declined approximately 39% year to date. Hendrikse notes that the stock remains on the firm's 90-day upside catalyst watch, with near-term profitability risks in both US and European markets remaining the key constraint (TipRanks, 16 April 2026).
Public.com (consensus overview)
Public.com aggregates five analyst ratings on NYSE-listed STLA and records a Buy consensus, with 20% Strong Buy, 20% Buy and 60% Hold, alongside a 12-month average price target of $11.59. The platform notes that ratings remain subject to frequent revision as the group's turnaround timeline develops (Public.com, 30 March 2026).
MarketBeat (consensus overview)
MarketBeat aggregates 19 brokerage ratings on NYSE-listed STLA and records an average Hold consensus, comprising 3 sell, 11 hold, 4 buy and 1 strong buy, with a one-year average price target of $11.12. The range spans $8–$15. Litigation risk from multiple class-action notices tied to disclosures made between February 2025 and February 2026 is cited as an additional source of near-term uncertainty (MarketBeat, 11 April 2026).
MarketScreener (consensus overview)
MarketScreener tracks a panel of 27 analysts covering STLAM on the Milan exchange and records a mean Outperform consensus, with an average 12-month price target of €8.10, a high of €12.50 and a low of €5. The wide spread between the low and high targets reflects diverging views on the pace of the group's operational and balance sheet recovery amid negative free cash flow guidance for 2026 (MarketScreener, 17 April 2026).
Predictions and third-party forecasts are inherently uncertain, as they cannot fully account for unexpected market developments. Past performance is not a reliable indicator of future results.
STLAM stock price: Technical overview
The STLAM stock price trades at €7.51 in early European trade as of 9:59am UTC on 21 April 2026 21 April 2026, sitting above its short- and medium-term simple moving average cluster, where the 20- and 50-day SMAs stand at approximately €6.54 and €6.38 respectively, according to TradingView data. The share price also remains above the 10-day SMA near €7.02, though the 100- and 200-day SMAs at €7.73 and €8.10 respectively sit above current levels and represent longer-term overhead references.
Momentum is firm: the 14-day relative strength index registers 68.2, sitting towards the upper end of the neutral-to-firm range without yet reaching technically stretched territory above 70. The average directional index at 28.7 indicates an established trend, consistent with the recent directional move higher from mid-month lows.
On the topside, the classic R1 pivot at €6.73 has already been cleared. R2 near €7.40 is the next reference, with R3 at €8.78 marking a broader area of interest if upside momentum extends. On pullbacks, the classic pivot point at €6.02 represents initial support. Below that, S1 at approximately €5.35 stands out as the next notable reference (TradingView, 21 April 2026).
This is technical analysis for informational purposes only and does not constitute financial advice or a recommendation to buy or sell any instrument.
Stellantis share price history (2024–2026)
STLAM’s stock price traded near €23 in late April 2024 before beginning a long and steep decline that characterised the following 18 months.
The stock fell sharply through the second half of 2024, dropping from around €19 in July to close the year near €12.60 in December, as profit warnings and leadership changes weighed on sentiment. The slide continued into early 2025, with STLAM trading above €13 in February before accelerating lower through the spring. A brief recovery attempt took the stock back towards €11.60 in March 2025, but further selling pressure dragged it below €10 by late April 2025.
The stock found a temporary floor around €7.50–€8 during the summer and autumn of 2025, briefly recovering towards €10.50 in December 2025 before pulling back again. January 2026 opened around €9.71, and a sharp drop in early February brought the price down to the €6 area within days of a results-related announcement, marking a significant new low for the two-year period. STLAM has since recovered from those lows, trading at €7.53 on 21 April 2026, approximately 67% below the levels seen in late April 2024.
Past performance is not a reliable indicator of future results. Share prices are indicative and may differ from live market prices.
Stellantis (STLAM): Capital.com analyst view
Stellantis (STLAM) has endured a difficult two-year period, with the share price falling sharply from the mid-€20s in mid-2024 to lows near €6 in early 2026, reflecting the market’s reaction to a series of profit warnings, leadership changes and the suspension of its dividend. The group’s ongoing strategic reset, including its AI collaboration with Microsoft announced in April 2026 and a stated focus on operational efficiency, may represent early steps towards stabilisation. However, it is still unclear whether these initiatives will translate into improved financial results, and execution risk remains considerable in a challenging macroeconomic and tariff environment.
At the same time, the stock’s recovery from February 2026 lows towards €7.50 by mid-April 2026 suggests that some investors may be reassessing the risk/reward profile at these levels, particularly ahead of Q1 2026 results due on 30 April. However, persistent headwinds, including negative free cash flow guidance for 2026, ongoing US tariff uncertainty and a wide range of analyst price targets, indicate that sentiment remains divided and the path ahead is uncertain.
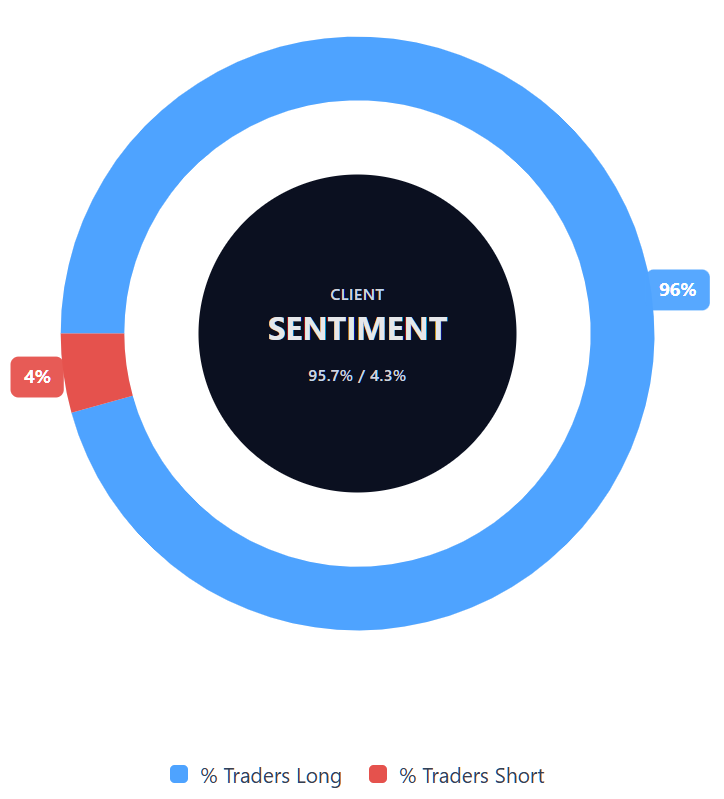
Capital.com’s client sentiment for Stellantis CFDs
As of 21 April 2026, Capital.com client positioning in Stellantis CFDs sits at 95.7% buyers and 4.3% sellers, placing sentiment firmly in a heavy-buy, one-sided-towards-long territory. This snapshot reflects open positions on Capital.com and can change rapidly as market conditions evolve.
Summary – Stellantis 2026
- Stellantis (STLAM) trades at €7.51 as of 9:59am UTC on 21 April 2026, down sharply from around €23 in April 2024, though it has recovered from February 2026 lows near €6.
- Key drivers include the group’s ongoing strategic reset, a Microsoft AI partnership announced in April 2026, EU–US tariff uncertainty and negative free cash flow guidance for 2026.
- Q1 2026 results are due on 30 April; Citi raised its target to €7.50 on 16 April, while Morgan Stanley maintained a more cautious €6 target with an Equal Weight rating.
- European EV registrations rose 29.4% year on year in Q1 2026, a potentially supportive sector tailwind, though execution risk and wide analyst target ranges reflect divided sentiment.
Past performance is not a reliable indicator of future results.
FAQ
Who owns the most Stellantis stock?
Stellantis has a concentrated shareholder base, with the largest stakes historically linked to the Peugeot family’s investment vehicle, Exor, and the French state-backed public investment bank Bpifrance. However, ownership levels can change over time as institutional investors, founding shareholders and related entities adjust their holdings. For the most accurate picture, it’s best to check Stellantis’ latest annual report or regulatory filings, as these provide the most up-to-date breakdown of major shareholdings.
What is the 5 year Stellantis share price forecast?
There is no single reliable five-year STLAM stock forecast, because long-term projections depend on variables that can change materially over time. These include demand across key auto markets, electric vehicle adoption, tariffs, margins, restructuring progress and cash flow delivery. Analyst targets in the article focus on the next 12 months rather than five years, which reflects the uncertainty involved. Longer-term forecasts should therefore be viewed as speculative scenarios rather than dependable indicators.
Is Stellantis a good stock to buy?
Whether Stellantis is a good stock to buy depends on an individual’s goals, risk tolerance and time horizon. The article points to a mixed picture: the share price has fallen sharply over two years, but it has also recovered from recent lows. At the same time, restructuring efforts, tariff exposure, negative free cash flow guidance and varied analyst targets show that uncertainty remains high. That means the stock may be assessed differently by different market participants.
Could Stellantis stock go up or down?
Stellantis stock could move in either direction, as its price is influenced by both company-specific and broader market factors. In the near term, traders may watch Q1 2026 results, tariff developments, execution of the group’s strategic reset and changes in sentiment across the European auto sector. Technical levels can also shape short-term price action. Even when momentum appears firm, markets can reverse quickly, so directional outcomes remain uncertain rather than fixed.
Should I invest in Stellantis stock?
Only you can decide whether Stellantis fits your portfolio, financial situation and appetite for risk. This article does not provide investment advice or a recommendation to buy or sell. Instead, it outlines some of the main factors shaping the stock, including analyst targets, technical levels, historical price performance and key business developments. If you are considering an investment, it may help to review the company’s fundamentals, latest filings and relevant risks before making any decision.
Can I trade Stellantis CFDs on Capital.com?
Yes, you can trade Stellantis CFDs on Capital.com. Trading share CFDs lets you speculate on price movements without owning the underlying asset and to take long or short positions. However, contracts for difference (CFDs) are traded on margin, and leverage amplifies both profits and losses. You should ensure you understand how CFD trading works, assess your risk tolerance, and recognise that losses can occur quickly.