Eni stock forecast: baleine FID, Q1 results and buyback
Eni S.p.A. is an Italian energy company, with recent developments including the Baleine Phase 3 FID and the second tranche of its €2.8bn share buyback. Explore third-party ENI price targets and technical analysis. Past performance is not a reliable indicator of future results.
Eni S.p.A. (ENI) is trading at €22.92 in early European trading as of 9:38am UTC on 1 June 2026, near the top of its intraday range of €22.28–€22.93, as the session price moves close to the upper bound of the day’s quoted band. Past performance is not a reliable indicator of future results.
Sentiment around ENI has been supported by a sharp move in crude oil, with Brent futures rising above $93 per barrel and WTI gaining nearly 3% on the session after Israel expanded military operations into southern Lebanon, heightening Middle East supply-disruption concerns (HDFC Sky, 1 June 2026). At the company level, Eni approved the final investment decision (FID) for the Baleine Phase 3 project in Côte d'Ivoire on 25 May 2026, targeting an increase in oil production from 60,000 to 150,000 barrels per day alongside a new FPSO unit (Enerdata, 28 May 2026). The start of the second tranche of Eni's €2.8 billion share buyback programme, confirmed by the company on 27 May 2026, also adds a corporate capital-return backdrop (Eni, 27 May 2026). Past performance is not a reliable indicator of future results.
ENI: buyback, Baleine FID and third-party targets
As of 1 June 2026, third-party Eni stock predictions show a broadly constructive stance as of late May 2026, shaped by the company's expanded €2.8 billion buyback programme, 9% upstream production growth in Q1, and Brent crude exposure.
MarketScreener (Borsa Italiana consensus)
MarketScreener aggregates 21 analyst recommendations on the Borsa Italiana-listed shares, reporting a mean 12-month price target of €25.40, a high estimate of €30, and a low of €19. The Outperform consensus reflects analysts' support for Eni's capital returns strategy and upstream growth pipeline, with the average target implying roughly 12% upside to the last close of €22.64 as of 28 May 2026 (MarketScreener, 28 May 2026).
MarketBeat (NYSE-listed ADR consensus)
MarketBeat compiles ratings from 13 Wall Street analysts covering Eni's NYSE-listed ADR (E), arriving at a consensus 12-month price target of $42.30, with a high estimate of $64.30 and a low of $28. The consensus rating stands at Moderate Buy, comprising two strong buy, six buy, and five hold ratings, with analysts weighing Eni's improved capital return profile against commodity price sensitivity and the ADR's strong year-to-date performance (MarketBeat, 30 May 2026).
Jefferies (Buy reiteration)
Jefferies analyst Mark Wilson reiterated a Buy rating with a €30 price target on the Borsa Italiana-listed shares, maintaining his positive stance after Eni reported mixed Q1 results but raised full-year cash flow guidance. Wilson cited Eni's upstream growth trajectory and enlarged buyback programme as key supports, with the reiteration coming amid an Outperform consensus across the broader analyst pool (The Globe and Mail, 22 May 2026).
Simply Wall St (consensus snapshot)
Simply Wall St reports that 20 analysts covering Eni hold a consensus 12-month price target of €25.18, with the most bullish individual estimate at €30 per share and the most cautious at €19, as captured following the Q1 2026 earnings round. The consensus remained stable relative to pre-results levels, with analysts noting that improved EPS expectations for 2026, revised to €2.66 per share, were broadly offset by caution around downstream weakness and commodity price uncertainty (Simply Wall St, 28 April 2026).
Predictions and third-party forecasts are inherently uncertain, as they cannot fully account for unexpected market developments. Past performance is not a reliable indicator of future results.
Eni S.p.A. earnings: latest results and upcoming schedule
Eni reported its Q1 2026 results on 23 April 2026, posting adjusted net profit of €1.3 billion, below analyst expectations, amid softer downstream and chemical margins (Eni, 24 April 2026). Oil and gas production grew 9% year on year in the quarter, and the company raised its full-year 2026 cash flow guidance to €13.8 billion at a revised Brent scenario, while lifting the buyback programme by approximately 90% to €2.8 billion (Reuters, 24 April 2026). The programme could potentially expand to €4 billion, subject to commodity price conditions (MarketBeat, 30 May 2026).
Eni's next scheduled earnings release is the Q2 2026 results, estimated for Friday, 24 July 2026, covering the three months to 30 June 2026 (MarketBeat, 30 May 2026). Investors and analysts have flagged Brent crude trajectory, upstream production continuity, and progress on the Baleine Phase 3 final investment decision as key variables that could influence Q2 performance against current consensus estimates (Eni, 25 May 2026).
ENI stock price: Technical overview
The ENI stock price is trading at €22.92 as of 9:38am UTC on 1 June 2026, within the session’s intraday range of €22.28–€22.93, and below the 20/50/100/200-day SMAs at approximately €23.26 / €23.43 / €20.96 / €18.24. The last price sits beneath the 20-day and 50-day SMA levels, though it remains above the 100-day and 200-day SMAs, which continue to trail well below current trade.
Momentum indicators point to a mixed-to-soft short-term picture. The 14-day RSI reads 46.90, placing it in neutral territory with a slightly soft tone below the midpoint. The average directional index at 12.90 is below 15, indicating a weak and directionless trend environment by that measure, consistent with the absence of a clear trending impulse in either direction.
On the topside, the classic R1 pivot at €23.84 represents the nearest reference above the last price; a daily close through there would put the R2 level at €25.15 in view. On pullbacks, the classic pivot point at €23.03 offers initial support, with S1 at €21.72 the next meaningful reference below should that level give way (TradingView, 1 June 2026).
This is technical analysis for informational purposes only and does not constitute financial advice or a recommendation to buy or sell any instrument.
Eni share price history (2024–2026)
ENI’s stock price in the low-to-mid €14 range and held relatively steady throughout the year, trading in a narrow band roughly between €13.57 and €14.82, with limited directional conviction as energy markets digested shifting OPEC+ output policy and softer European demand.
The stock carried that subdued tone into early 2025, closing out 2024 at €13.10 before edging up to €13.50 on 2 January 2025. A sharper deterioration followed from late March into April 2025, coinciding with a broad risk-off move in global equity markets and a slump in crude oil prices amid trade tariff escalation. ENI hit a two-year low of €11.28 on 9 April 2025. Its recovery from that trough was steady but measured, with the stock closing 2025 at €16.18.
2026 brought a markedly different pattern. ENI advanced through the first quarter, touching an intraday peak of €25.06 on 7 April 2026 as Brent crude surged and Eni posted strong upstream production growth. A pullback followed in mid-to-late April before the stock stabilised.
ENI closed at €22.93 on 1 June 2026, approximately 39.5% up year to date and 73.7% higher year on year.
Past performance is not a reliable indicator of future results. Share prices are indicative and may differ from live market prices.
Eni (ENI): Capital.com analyst view
ENI’s price performance in 2026 reflects a notable re-rating, with the stock gaining approximately 39.5% year to date by 1 June 2026. The move has been driven by a sharp rise in Brent crude amid Middle East supply concerns, 9% upstream production growth in Q1, and Eni’s near-doubling of its 2026 buyback programme to €2.8bn. The company’s revised full-year cash flow guidance of €13.8bn and the final investment decision on the Baleine Phase 3 project in Côte d’Ivoire have added further corporate momentum.
That said, ENI’s close correlation to crude oil prices cuts both ways. A reversal in Brent, a reduction in the geopolitical risk premium, or a continuation of the downstream and chemical margin weakness visible in Q1 could weigh on the stock without a corresponding offset from upstream volumes.
The longer-term picture adds further nuance. Eni’s energy transition strategy, including biorefinery investments and its net-zero 2050 commitment, could support valuation among ESG-focused investors as the sector evolves. However, the pace and cost of that transition represent an ongoing execution risk. Any significant shift in European energy policy or sustained decline in commodity prices could also challenge Eni’s ability to maintain its current buyback pace and dividend trajectory.
Capital.com’s client sentiment for Eni CFDs
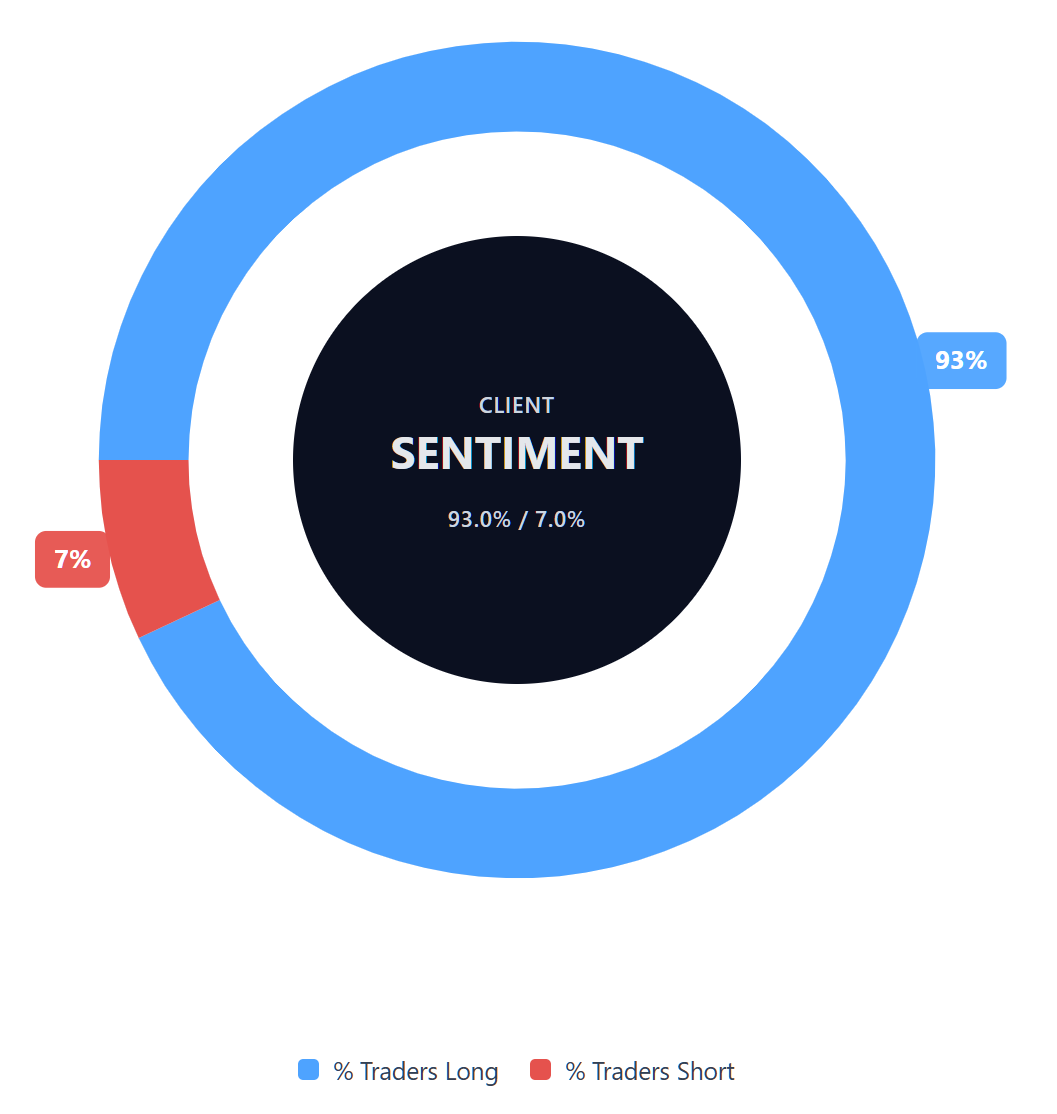
As of 1 June 2026, Capital.com client positioning in Eni CFDs client positioning in Eni S.p.A. (ENI) stands at 93% buyers vs 7% sellers, putting buyers ahead by 86 percentage points and placing sentiment in one-sided long territory. This snapshot reflects open positions on Capital.com and can change.
Summary – Eni 2026
- ENI is trading at €22.92 as of 9:38am UTC on 1 June 2026, up approximately 39.5% year to date and 73.7% year on year.
- Key price drivers include Brent crude exposure, Middle East supply-disruption risk, and Eni’s expanded €2.8bn share buyback programme.
- Eni raised full-year 2026 cash flow guidance to €13.8bn after Q1 upstream production grew 9% year on year.
- The Baleine Phase 3 FID, approved on 25 May 2026, targets an increase in oil output from 60,000 to 150,000 barrels per day.
Past performance is not a reliable indicator of future results.
FAQ
Who owns the most Eni S.p.A. stock?
Eni S.p.A. has a mixed ownership structure, with institutional investors, retail shareholders and Italian state-linked entities among its shareholder base. For traders, ownership can matter because large strategic holders may influence capital allocation, dividend policy, buybacks and long-term investment priorities. However, ownership alone shouldn’t be used as a basis for a trading decision. It’s better viewed alongside Eni’s earnings, crude oil exposure, balance sheet position, production outlook and wider market conditions.
What is the 5 year Eni S.p.A. share price forecast?
The article focuses on 12-month third-party analyst targets rather than five-year ENI stock forecasts. Late-May 2026 consensus targets for the Milan-listed shares cluster around €25.18–€25.40, with individual estimates ranging from €19 to €30. Longer-term forecasts are more uncertain because Eni’s share price may be affected by Brent crude prices, upstream production, downstream margins, buyback execution, energy policy, and the cost and pace of its energy transition strategy.
Is Eni S.p.A. a good stock to buy?
Whether Eni S.p.A. is a good stock to buy depends on a trader or investor’s objectives, risk tolerance, time horizon and view of the energy sector. The article notes supportive factors, including stronger upstream production, higher cash flow guidance and an expanded buyback programme. It also highlights risks, including crude oil sensitivity, downstream and chemical margin pressure, commodity price uncertainty and execution risk around the energy transition. This content is informational and not investment advice.
Could Eni S.p.A. stock go up or down?
Yes. Eni S.p.A. stock could move in either direction. Potential upside drivers include higher crude oil prices, continued upstream production growth, successful buyback execution and progress on projects such as Baleine Phase 3. Downside risks include a reversal in Brent crude, weaker geopolitical risk premium, softer downstream margins, weaker earnings momentum or changes in European energy policy. Technical indicators in the article also suggest a mixed-to-soft short-term picture rather than a clear directional signal.
Should I invest in Eni S.p.A. stock?
That decision depends on your financial goals, portfolio, risk appetite and investment timeframe. Eni’s recent performance has been supported by crude oil exposure, capital returns and upstream growth, but the company remains sensitive to commodity prices, geopolitical developments and sector-specific risks. You should consider independent research and, where appropriate, professional advice before making investment decisions. Past performance is not a reliable indicator of future results, and forecasts can change as new information emerges.
Can I trade Eni S.p.A. CFDs on Capital.com?
Yes, you can trade Eni CFDs on Capital.com. Trading share CFDs lets you speculate on price movements without owning the underlying asset and to take long or short positions. However, contracts for difference (CFDs) are traded on margin, and leverage amplifies both profits and losses. You should ensure you understand how CFD trading works, assess your risk tolerance, and recognise that losses can occur quickly.