Ethereum price prediction: BlackRock staking ETF launch
Ethereum is a decentralised blockchain network whose near-term outlook is shaped by BlackRock’s staking-enabled ETF launch, the Pectra upgrade and US interest rate expectations. Past performance is not a reliable indicator of future results. Explore third-party ETH price targets and technicals.
Ethereum (ETH/USD) is trading at $2,159.29 as of 10:23am UTC on 24 March 2026, within an intraday range of $2,032.71–$2,181.17. Past performance is not a reliable indicator of future results.
Several factors are shaping ETH's near-term direction. BlackRock launched a staking-enabled Ethereum ETF product in mid-March 2026, introducing a new institutional demand channel for spot ETH (Yahoo Finance, 12 March 2026). This development followed the Ethereum Pectra (Prague-Electra) upgrade, which went live on mainnet in May 2025 and raised validator stake limits, expanded blob throughput for Layer-2 networks, and introduced account abstraction improvements (Crypto APIs, 10 April 2025).
The broader macro backdrop remains a swing factor, with the Federal Reserve holding rates at 3.5%–3.75% at its March 2026 meeting while upgrading inflation forecasts (CNBC, 18 March 2026), which keeps risk appetite in crypto markets sensitive to any shift in rate-cut expectations (Crypto.com, 18 March 2026).
Ethereum price prediction 2026-2030: Analyst price target view
As of 24 March 2026, third-party ETH price predictions reflect a broad spread of near-term and full-year estimates, with Federal Reserve policy, institutional ETF inflows, and Layer 2 network growth cited as the most common swing factors across sources.
CoinCodex (algorithmic full-year channel)
CoinCodex places ETH within a 2026 full-year trading channel of $2,130.45–$4,018.82, with an end-of-year point estimate of $2,642.20 and an annualised average of $2,879.74. The model draws on historical volatility cycles and Bitcoin halving patterns, noting that 22 of 30 tracked technical indicators registered bearish signals, while the 14-day RSI sat at 54.12, indicating neutral momentum (CoinCodex, 24 March 2026).
Coinpedia (recovery and resistance targets)
Coinpedia projects an initial 2026 recovery target of $2,878, with a subsequent resistance retest at $4,076 possible if buyer demand consolidates at the $1,700–$1,900 support band. The rationale cites rising whale transaction counts above $1 million over the preceding 30 days, a declining ETH balance on centralised exchanges, and $38.2 billion in total value locked (TVL) across 146 active Layer 2 networks as structural demand factors (Coinpedia, 17 March 2026).
Finance Magnates (institutional bank targets)
Finance Magnates reports that Standard Chartered set an ETH price target of $5,440 for October 2026, citing ETF inflows and investor demand, while a broader traditional finance consensus range of $6,500–$7,500 for 2026 was linked to corporate treasury accumulation dynamics. The publication notes that both targets were published against a backdrop of ETH trading near $2,000 and that technical momentum remained bearish until ETH reclaimed $3,000 (Finance Magnates, 9 February 2026).
Changelly (March 2026 monthly range)
Changelly projects a March 2026 monthly floor of $2,053.04, a peak of $2,286.17, and an average of $2,169.61, derived from a combination of technical indicators and machine-learning models. The methodology references a bearish sentiment reading and an extreme fear reading on the Fear & Greed Index at the time of capture (Changelly, 22 March 2026).
Predictions and third-party forecasts are inherently uncertain, as they cannot fully account for unexpected market developments. Past performance is not a reliable indicator of future results.
ETH price: Technical overview
The ETH/USD price trades at $2,159.29 as of 10:23am UTC on 24 March 2026, holding above a mixed moving-average cluster where the 20/50/100/200-day SMAs sit at approximately $2,105 / $2,044 / $2,520 / $3,138 respectively. The shorter-dated SMAs (20 and 50) align constructively beneath the current price, while the 100 and 200-day SMAs overhead act as a longer-term resistance shelf that the price has not yet reclaimed.
Momentum is neutral to mild: the 14-day RSI reads 52.9, sitting in the mid-range and indicating consolidation rather than a directional impulse in either direction. The ADX(14) at 19.8 falls below the 25 threshold, indicating that no established trend is currently in force.
To the upside, the first reference is the classic R1 pivot at $2,378, where a convincing daily close above this level would put the R2 area near $2,792 back in view. A sustained move through R2 would then reopen the path towards the 100-day SMA shelf at $2,520 as an intermediate waypoint.
On pullbacks, the classic pivot at $2,060 provides the initial support reference, broadly coinciding with the 20-day SMA near $2,105 and forming a near-term floor. If ETH falls below that zone, it would bring S1 at $1,647 into focus as the next meaningful level, with the 50-day SMA at $2,044 offering a secondary buffer in between (TradingView, 24 March 2026).
This is technical analysis for informational purposes only and does not constitute financial advice or a recommendation to buy or sell any instrument.
Ethereum price history (2024–2026)
Ethereum launched its mainnet in July 2015, with ETH initially trading at fractions of a dollar. The token grew significantly through successive bull cycles, eventually reaching an all-time high of $4,878.26 in November 2021.
ETH/USD’s price trajectory over the two years to 24 March 2026 has included peaks, a sharp correction, and gradual recovery. The token opened March 2024 around $3,594, climbed towards a local high above $4,000 in mid-October 2024, then drifted back to close 2024 at roughly $3,332. Into early 2025, ETH held above $3,300 through January before a significant sell-off began. Prices slid from around $3,118 at the end of January 2025 to a cycle low near $1,389 on 9 April 2025, amid broad crypto market weakness and macro headwinds.
Recovery followed through the summer of 2025, with ETH climbing back above $3,500 by late August and touching $3,914 in early November 2025 — its highest level since early 2025. That momentum faded into year-end, with the token closing 2025 around $2,968. January 2026 opened with a brief rally above $3,300, but ETH reversed sharply through late January and February, falling to a local low near $1,746 on 6 February 2026.
ETH closed at $2,160.35 on 24 March 2026, approximately 35.2% down year on year and roughly 3.5% lower year to date from the 1 January 2026 open of $3,001.03.
Past performance is not a reliable indicator of future results. Share prices are indicative and may differ from live market prices.
Capital.com analyst view: Ethereum
Ethereum's price performance over the past two years reflects a market shaped by competing forces. The launch of BlackRock's staking-enabled ETHB ETF in March 2026 marked a meaningful development for institutional access, adding yield potential to regulated exposure and addressing a long-standing gap in existing spot ETF products. Tokenised real-world assets on the Ethereum network grew from $4.12 billion to $12.18 billion through 2025, and stablecoin value on the network reached $165.13 billion, pointing to expanding utility as a settlement layer. These factors offer a constructive backdrop. However, ETH remains roughly 35% below its 52-week high as of 24 March 2026, and the token has historically shown sensitivity to macro shifts, with Federal Reserve rate expectations and broader risk sentiment capable of unwinding institutional inflows quickly.
Layer 2 network growth presents a similar duality: while it broadens Ethereum's ecosystem reach and user base, analysts have noted that activity concentrated on a small number of dominant rollups risks fragmenting liquidity and, in a bear-case scenario, could reduce fee revenue accruing to the Ethereum mainnet. Regulatory clarity under the current SEC administration has been cited as a tailwind for institutional engagement, yet residual uncertainty around enforcement and market structure rules means that compliance risk has not fully dissipated.
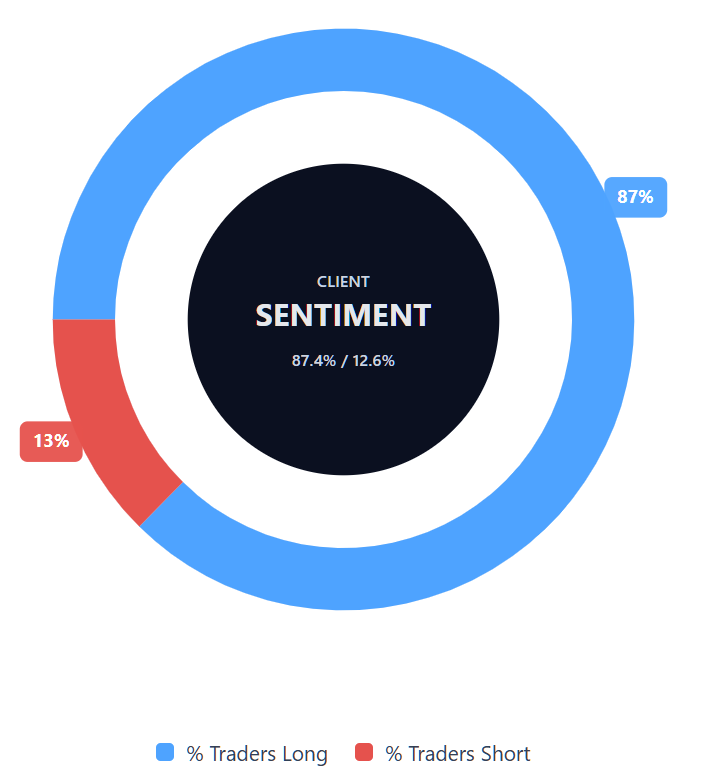
Capital.com’s client sentiment for Ethereum CFDs
As of 24 March 2026, Capital.com client positioning in Ethereum CFDs shows 87.4% buyers vs 12.6% sellers, putting buyers ahead by 74.8 percentage points and placing sentiment firmly in a heavy-buy, one-sided-long territory. This snapshot reflects open positions on Capital.com and can change.
Summary – Ethereum (2026)
- As of 10:23am UTC on 24 March 2026, ETH trades at $2,159.29, down roughly 35% year on year and approximately 28% below its January 2026 peak near $3,384.
- Technical indicators are mixed: short-term SMAs sit below the current price, while the 100 and 200-day SMAs at $2,520 and $3,138 remain overhead resistance; RSI reads 52.9, indicating neutral momentum.
- Key drivers include BlackRock's staking-enabled ETH ETF launch, Federal Reserve rate policy, Layer 2 network growth, and expanding real-world asset tokenisation on the Ethereum network.
- Risks include macro sensitivity to rate expectations, potential fee revenue dilution from Layer 2 fragmentation, and residual regulatory uncertainty under the current SEC administration.
- Recent news has focused on ETH reclaiming the $2,000 level in early March 2026, a regulatory clarification on liquid staking status, and continued institutional ETF inflow activity.
Past performance is not a reliable indicator of future results.
FAQ
Who owns the most Ethereum?
What is the 5 year Ethereum price forecast?
Is Ethereum a good asset to buy?
Could Ethereum go up or down?
Should I invest in Ethereum?
Can I trade Ethereum CFDs on Capital.com?
Yes, you can trade Ethereum CFDs on Capital.com. Trading crypto CFDs lets you speculate on price movements without owning the underlying asset and to take long or short positions. However, contracts for difference (CFDs) are traded on margin, and leverage amplifies both profits and losses. You should ensure you understand how CFD trading works, assess your risk tolerance, and recognise that losses can occur quickly.