Ethereum price prediction: ETF inflows and macro backdrop
Ethereum trades near the top of its daily range after U.S.-listed spot Ethereum ETFs recorded $27m in net inflows on 13 March 2026, against a weaker broader macro backdrop. Past performance is not a reliable indicator of future results. Explore third-party ETH price targets and technical analysis.
Ethereum (ETH/USD) is trading at $2,270.93 on Capital.com's quote feed as of 11:55am UTC on 16 March 2026, near the top of its $2,084.52-$2,280.55 intraday range. Past performance is not a reliable indicator of future results.
Sentiment across digital assets has received partial support from continued inflows into spot Ethereum ETFs, with U.S.-listed products recording approximately $27m in net inflows on 13 March 2026. At the same time, the broader macro backdrop is weighing on risk assets. Brent crude is trading above $100 amid the ongoing closure of the Strait of Hormuz, the VIX closed on Friday at 27.19, and U.S. Q4 2025 GDP was revised down to an annualised 0.7%. Markets are also positioning ahead of Federal Reserve, ECB, and Bank of England rate decisions due this week, with investors watching for signs that policymakers are concerned about stagflation risks created by the energy shock (Saxo Bank, 16 March 2026).
Ethereum price prediction 2026-2030: Analyst price target view
As of 16 March 2026, third-party ETH price predictions reflect a wide range of outcomes, shaped by Federal Reserve policy expectations, ETF flow dynamics, on-chain network metrics, and broader crypto market sentiment. The following targets summarise leading estimates from established research sources, ordered from lower to higher projections.
Changelly (March 2026 range)
Changelly projects that ETH will not fall below $2,097.36 in March 2026, with a potential peak of $2,520.45 for the month and an average trading value of $2,308.91. The estimate is derived from a combination of technical indicators and machine-learning models, with the analysis noting a bearish market sentiment reading of 22% and a Fear and Greed Index at 15 (extreme fear) at the time of capture (Changelly, 15 March 2026).
CoinCodex (five-day model target)
CoinCodex models ETH reaching $2,359.17 by 20 March 2026, representing a 10.88% increase from the 16 March 2026 reference price of $2,238.11, amid a broader bearish technical outlook in which 19 of 30 tracked indicators signal a negative forecast. The note flags key support levels at $2,073.25, $2,049.63, and $2,033.55, with the RSI (14) at 53.11 indicating neutral momentum (CoinCodex, 16 March 2026).
Coinpedia (recovery and resistance targets)
Coinpedia projects ETH recovering towards $2,878 in March 2026, with a secondary resistance retest at $4,076 possible later in the year, as ascending channel support from the multi-year trendline active since 2020 underpins the structure. The rationale cites rising whale transaction counts above $1m, a declining ETH balance on centralised exchanges, and $38.2bn in total value locked across 146 active Layer 2 networks as structural support factors (Coinpedia, 11 March 2026).
Standard Chartered (revised year-end institutional target)
Standard Chartered's digital assets research team maintains a year-end 2026 ETH price target of $4,000, as reported by Yahoo Finance, after revising it down from $7,500 in February 2026 amid weak ETF inflow data. The bank links any recovery in ETH towards that level to the Federal Reserve resuming rate cuts, which it does not expect before June 2026, while retaining a longer-dated $40,000 target for end-2030 (Yahoo Finance, 3 March 2026).
Predictions and third-party forecasts are inherently uncertain, as they cannot fully account for unexpected market developments. Past performance is not a reliable indicator of future results.
ETH price: Technical overview
The ETH/USD price trades at $2,270.93 as of 11:55am UTC on 16 March 2026, holding near the top of its $2,084.52-$2,280.55 intraday range. The daily chart shows price comfortably above the short-to-medium moving average cluster, with the 20/50/100/200-day SMAs sitting at approximately 2,041 / 2,128 / 2,600 / 3,225, though the 100 and 200-day SMAs remain well above current levels and carry sell signals. Short-term moving average alignment is constructive: the 10, 20, 30, and 50-day SMAs all register buy signals, with price trading above the 20-over-50 level, keeping the near-term bias firm.
Momentum is supportive but not stretched. The 14-day RSI reads 63.1, sitting in the upper-neutral range and consistent with a market that has recovered from oversold territory without yet entering overbought conditions. The ADX (14) at 24.3 sits just below the 25 threshold, suggesting trend strength is building but is not yet confirmed as an established directional move.
To the topside, the classic R1 at $2,378.3 is the first reference to watch. A convincing daily close above that level would put the R2 at $2,791.5 back in view. The $2,515.9 exponential moving average (100-day) also represents a meaningful overhead shelf, given that it sits roughly 10.8% above the last price and aligns with the broader zone where sell signals begin to cluster.
On pullbacks, the classic pivot at $2,060.0 provides initial support, reinforced by the volume-weighted moving average at $2,028.1 and the 50-day SMA near $2,128. If price loses the $2,060 pivot on a daily close basis, it could open the way for a fade towards S1 at $1,646.8, which broadly coincides with the next meaningful downside reference on the classic pivot table (TradingView, 16 March 2026).
This is technical analysis for informational purposes only and does not constitute financial advice or a recommendation to buy or sell any instrument.
Ethereum price history (2024–2026)
Ethereum launched its mainnet in July 2015, with ETH trading at well under $1 for much of its first year. By the time this dataset opens in March 2024, ETH was already well into a bull run, closing at $3,644 on 17 March 2024 and pushing further into the $3,500-$3,900 range through early summer.
ETH/USD’s price reached its peak within this two-year window in early October 2025, touching a high of $4,758.62 on 7 October 2025, before a sharp reversal dragged it back below $3,600 by November. A second attempt at recovery stalled in mid-January 2026, with ETH briefly trading above $3,300 on 18 January 2026, before a steep February sell-off brought the price to a two-year low of $1,745.79 on 6 February 2026 - a drop of roughly 53% in under three weeks.
Recovery has been gradual since then, with ETH climbing back through the $2,000-$2,200 range across March 2026. ETH closed at $2,967.68 on 31 December 2025, ending the year down approximately 10.9% from its 31 December 2024 close of $3,331.81. ETH closed at $2,272.78 on 16 March 2026, which is approximately 24.3% down year to date but 20.4% up year on year.
Past performance is not a reliable indicator of future results. Share prices are indicative and may differ from live market prices.
Capital.com analyst view: Ethereum
Ethereum's price trajectory over the past two years reflects a market pulled in competing directions. After setting a dataset high above $4,758 in October 2025, ETH has surrendered much of those gains, trading near $2,270.93 as of 16 March 2026 amid a broad macro-driven risk-off environment. The correction appears to reflect external pressures, including elevated geopolitical tensions, a sharp energy price shock, and reduced appetite for risk assets, rather than any obvious deterioration in the Ethereum network itself. Exchange supply of ETH has reportedly fallen to near decade lows, which some analysts interpret as long-term holders accumulating during weakness. However, declining ETF inflows and persistent macro headwinds suggest that institutional demand has not yet returned in force.
On the fundamental side, Ethereum's Layer 2 ecosystem continues to expand, with over 100 active L2 networks and more than 31 million daily transactions processed across the top 10 alone. Upcoming network upgrades, including Glamsterdam and Hegota, remain on the 2026 roadmap and could reinforce confidence in the development trajectory. That said, rising L2 activity has reduced fee revenue flowing back to Ethereum's base layer, and competition from faster alternative networks remains a structural challenge. The regulatory backdrop, shaped by the Trump administration's broadly pro-crypto stance and pending legislation such as the CLARITY Act, may support institutional adoption, though regulatory outcomes remain uncertain, and any legislative delays or reversals could weigh on sentiment.
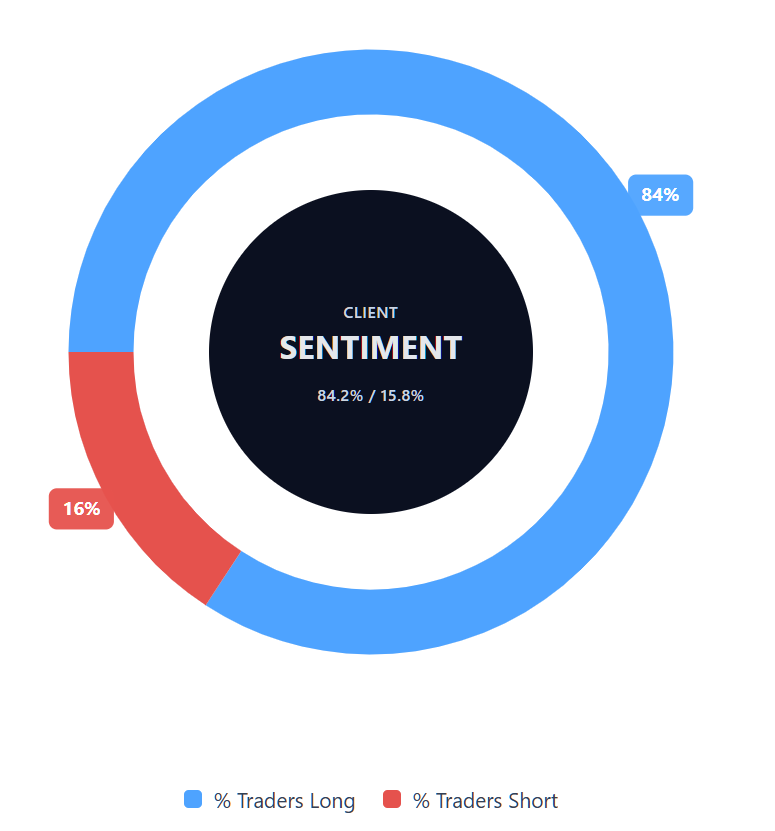
Capital.com’s client sentiment for Ethereum CFDs
As of 16 March 2026, Capital.com client positioning in Ethereum CFDs stands at 84.2% buyers and 15.8% sellers, putting buyers ahead by 68.4 percentage points. That places sentiment firmly in heavy-buy territory and signals a strongly one-sided lean towards long positions. This snapshot reflects open positions on Capital.com at the time of capture and can change rapidly as market conditions evolve.
Summary – Ethereum (2026)
- ETH trades at $2,270.93 as of 11:55am UTC on 16 March 2026, down around 24.3% year to date but up 20.4% year on year.
- The 14-day RSI sits at 63.1, in upper-neutral territory, with ADX at 24.3 suggesting trend strength is building but not yet firmly established.
- Key macro drivers include Federal Reserve rate-cut timing, elevated energy prices linked to the Strait of Hormuz closure, and a broadly risk-off equity environment weighing on crypto.
- Structural support factors include declining ETH balances on centralised exchanges, growing Layer 2 activity, and a broadly pro-crypto U.S. regulatory environment under the Trump administration.
Past performance is not a reliable indicator of future results.
FAQ
What is the latest Ethereum crypto price prediction?
How much ether is there?
Could Ethereum’s price go up or down?
Should I invest in Ethereum?
Can I trade Ethereum CFDs on Capital.com?
Yes, you can trade Ethereum CFDs on Capital.com. Trading crypto CFDs lets you speculate on price movements without owning the underlying asset and to take long or short positions. However, contracts for difference (CFDs) are traded on margin, and leverage amplifies both profits and losses. You should ensure you understand how CFD trading works, assess your risk tolerance, and recognise that losses can occur quickly.