Ethereum price prediction: ETF inflows, Fed decision
Ethereum (ETH) traded near $2,066 on 12 March 2026 after recovering from early-March levels near $2,000; spot Ethereum ETFs saw $12.6m net inflows on 10 March, with Fed policy in focus. Past performance is not a reliable indicator of future results. Explore third-party ETH price targets.
Ethereum (ETH/USD) is trading at $2,066.58 as of 3:34pm UTC on 12 March 2026, within an intraday range of $2,009.59 to $2,078.55. Past performance is not a reliable indicator of future results.
Broader risk appetite has improved across digital assets amid a more supportive macro backdrop, with ETH extending its recovery from early-March levels near $2,000. Spot Ethereum ETFs recorded a total net inflow of $12.6 million on 10 March 2026, led by the FETH product at $10.7 million, according to Farside Investors, reflecting continued institutional positioning in ETH-linked products. Market attention also remains on the Federal Reserve's scheduled rate decision on 18 March 2026 (Federal Reserve, 12 March 2026), with the prior day's US CPI release (US Bureau of Labor Statistics, 11 March 2026) shaping near-term rate expectations and broader risk sentiment ahead of that meeting.
Ethereum price prediction 2026-2030: Analyst price target view
As of 12 March 2026, third-party ETH price predictions show a wide divergence between near-term consolidation views and more constructive longer-dated scenarios, shaped by current technical weakness, ETF flow dynamics, and macro conditions.
Changelly (March 2026 monthly range)
Changelly models ETH trading between $2,022.58 and $2,432.27 across March 2026, with an average monthly price of $2,227.43. The service notes that bearish momentum persists, with the Fear and Greed Index registering 15 (extreme fear) as of the publication date, amid subdued risk appetite and short-term technical weakness across crypto markets (Changelly, 11 March 2026).
CoinCodex (2026 full-year channel)
CoinCodex places ETH within a full-year 2026 trading channel of $2,060.70 to $3,899.73, with an estimated annual average of $2,785.35 and an end-of-year point estimate of $2,434.49. The model incorporates historical volatility cycles and on-chain metrics, noting that 24 of 28 technical indicators signal bearish conditions as of 12 March 2026, while longer-term moving averages (MA100, MA200) continue to register buy signals (CoinCodex, 12 March 2026).
Coinpedia (H1 2026 structural level)
Coinpedia identifies a critical long-term ascending trendline as the key structural support for ETH entering 2026, a level that has underpinned every major cycle low since 2019. The publication notes that ETH's continued underperformance relative to Bitcoin, with the ETH/BTC ratio near cycle lows around 0.03, remains a headwind, with a sustained hold above trendline support a prerequisite for any meaningful recovery (Coinpedia, 7 March 2026).
The Motley Fool (2026 cycle view)
The Motley Fool published a contributor outlook projecting ETH could revisit levels near its all-time high of approximately $4,897, reported in 2025, citing Ethereum's maturing layer-2 ecosystem, rising developer activity, and expanded institutional access via spot ETF products as the primary catalysts for a potential recovery. The piece notes that Standard Chartered has referenced a $7,500 level under stronger institutional participation scenarios, while Citi has cited $4,500 (Yahoo Finance, 18 February 2026).
Predictions and third-party forecasts are inherently uncertain, as they cannot fully account for unexpected market developments. Past performance is not a reliable indicator of future results.
ETH price: Technical overview
The ETH/USD price trades at $2,066.58 as of 3:34pm UTC on 12 March 2026, holding near the upper end of the day's $2,009.59 to $2,078.55 intraday range. The short-term moving average picture is mixed: the 10/20-day SMAs sit tightly between $1,990 and $2,022, and price trades above this near-term cluster, while the 50-day SMA at $2,188 and the 100-day SMA at $2,637 remain overhead and signal selling pressure, keeping the broader trend under pressure.
The 20-over-50 alignment is not intact on the SMA basis, with the 20-day SMA at $1,990 sitting well below the 50-day at $2,188; the short-term buy signals from the 10 and 20-day SMAs reflect the current intraday bounce rather than a trend reversal. The 14-day RSI at 50.7 sits in neutral territory, offering no clear directional conviction, while the ADX at 23.4 falls just short of the 25 threshold that would confirm an established trend in either direction.
On the topside, the classic R1 pivot at $2,378 is the first meaningful reference; a daily close above that level would put the R2 area near $2,792 in view. The current price trades above the classic pivot point (P) at $2,060, which serves as initial support on any near-term pullback. Losing the P level would raise the risk of a move toward the S1 pivot at $1,647, with the 20-day SMA near $1,990 offering an intermediate reference along the way (TradingView, 12 March 2026).
This is technical analysis for informational purposes only and does not constitute financial advice or a recommendation to buy or sell any instrument.
Ethereum price history (2024–2026)
Ethereum's ether token (ETH) launched in 2015, with its native blockchain going live in July of that year. The prices below reflect ETH/USD market data from March 2024 to 12 March 2026.
ETH/USD’s price opened March 2024 around $3,138 and rose sharply into mid-March, reaching an intraday high of $4,087 on 13 March 2024 before pulling back. Prices held broadly in the $3,100 to $3,900 range through June 2024, before a sharp global risk-off event on 5 August 2024 dragged ETH to an intraday low of $2,116 – a near 40% drawdown from the June peak. The coin then recovered steadily into Q4 2024, closing the year at $3,332 on 31 December 2024.
The 2025 rally carried ETH to its two-year peak in early October 2025, with an intraday high of $4,759 on 7 October 2025. That strength faded into year-end, with ETH closing 2025 at $2,968 on 31 December – down roughly 11% from the prior year close, reflecting a sharp retreat from cycle highs in Q4. A further sell-off in early 2026 pushed prices to an intraday low of $1,746 on 6 February 2026, the weakest level in the two-year window.
ETH closed at $2,068 on 12 March 2026, approximately 31.1% down year to date but 8.3% up year on year.
Past performance is not a reliable indicator of future results. Share prices are indicative and may differ from live market prices.
Capital.com analyst view: Ethereum
Ethereum's price trajectory over the past two years illustrates the asset's capacity for both sharp gains and steep drawdowns. ETH climbed from around $3,138 in March 2024 to an intraday peak of $4,759 in October 2025, supported by growing institutional participation through spot ETF products, expanding layer-2 network activity, and broader crypto market conditions following the 2024 Bitcoin halving. However, those same conditions proved fragile: ETH surrendered the bulk of its gains in Q4 2025 and slid further to an intraday low of $1,746 in February 2026, underscoring how quickly sentiment can reverse in digital asset markets.
As of 12 March 2026, ETH trades at $2,066.58, sitting 31.1% below its 1 January 2026 open, though 8.3% above its level a year ago. ETF inflows and a stabilising macro backdrop may influence near-term demand, while persistent technical selling pressure from longer-dated moving averages and a compressed ETH/BTC ratio remain potential headwinds. Neither trend reliably predicts future direction, and ETH remains sensitive to regulatory developments, network-level changes, and broader risk appetite shifts that could push prices in either direction.
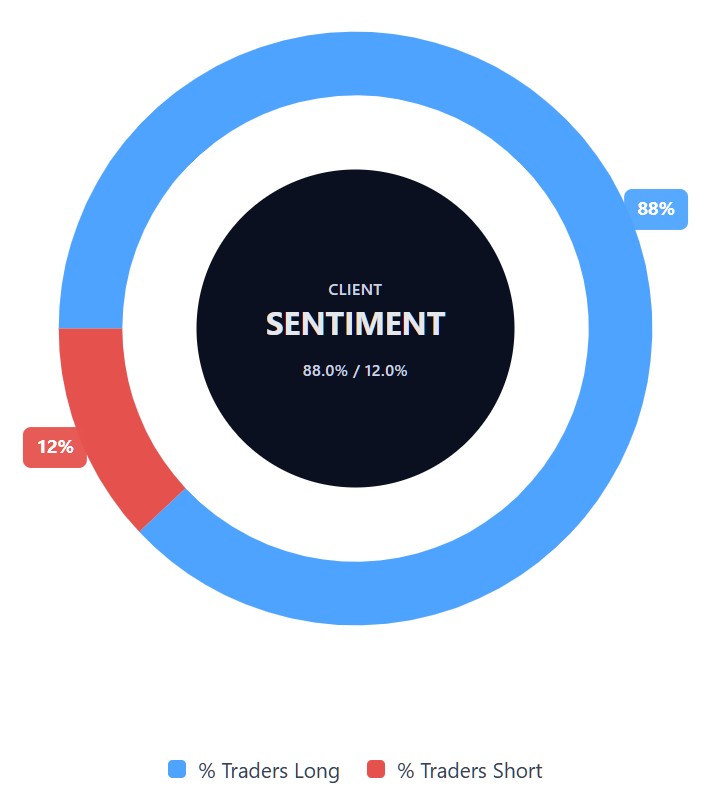
Capital.com’s client sentiment for Ethereum CFDs
As of 12 March 2026, Capital.com client positioning in Ethereum CFDs shows 88.0% buyers vs 12.0% sellers, putting buyers ahead by 76 pp. That skew indicates a high share of long positions. This snapshot reflects open positions on Capital.com and can change.
Summary – Ethereum (2026)
- ETH trades at $2,066.58 as of 3:34pm UTC on 12 March 2026, down 31.1% year to date but 8.3% above year-ago levels.
- The 14-day RSI sits at 50.7 (neutral), with the ADX at 23.4 indicating no firmly established trend in either direction.
- Classic pivot support sits at $2,060; a daily close above R1 at $2,378 would be the first meaningful upside reference, while S1 at $1,647 is the key downside level.
- Spot Ethereum ETFs recorded a net inflow of $12.6 million on 10 March 2026, suggesting continued but measured institutional demand.
- Macro focus includes the Federal Reserve's 18 March 2026 rate decision, with prior CPI data shaping near-term risk sentiment across digital assets.
Past performance is not a reliable indicator of future results.
FAQ
Could Ethereum’s price go up or down?
Yes. ETH can move sharply in either direction, sometimes within a single session. The article highlights a mixed technical picture around key support and resistance references, alongside macro events such as central bank decisions and inflation data that can influence risk appetite. ETF flows, regulation, network upgrades and changes in market positioning can also affect demand and volatility. Price movements are inherently uncertain, and past performance does not indicate future results.
Should I invest in Ethereum?
This depends on your objectives, time horizon and risk tolerance, and it is not something an article can decide for you. ETH has historically shown periods of rapid gains and steep drawdowns, and its price can react to technical signals, macro conditions and regulatory news. If you are considering exposure, you may want to assess how much volatility you can accept and whether you understand the risks involved. Consider seeking independent financial advice.