Eni stock forecast: Hormuz disruptions, March update
Eni is an Italy-based energy producer listed in Milan; its shares are sensitive to Brent, with investors focused on the 19 March 2026 Capital Markets Update and €0.26 dividend. Past performance is not a reliable indicator of future results.
Eni (ENI) is trading at €19.87 as of 3:17pm UTC on 4 March 2026, within a session range of €19.71–€20.41. The stock pulled back from Tuesday's close of €20.11 on Borsa Italiana, where over 14.4 million shares changed hands, leaving the price below the intraday high recorded earlier in the session.
Price action comes amid a sharp rise in crude benchmarks, with Brent futures rising for a second consecutive session after reports of Strait of Hormuz disruptions linked to conflict involving Iran (Reuters, 2 March 2026). Eni's own upstream profile – with 2025 production growth of 4% year on year exceeding guidance – adds a company-specific backdrop to the commodity-driven move (Eni, 26 February 2026). Investor attention is also turning to Eni's scheduled Capital Markets Update on 19 March 2026, at which the company is set to present its 2026–2029 strategic plan (MarketScreener, 10 December 2025). Separately, the board approved a third 2025 dividend tranche of €0.26 per share, with an ex-dividend date of 23 March 2026 (MarketScreener, 25 February 2026).
Eni stock forecast 2026–2030: Third-party price targets
As of 4 March 2026, third-party Eni stock predictions span a wide range as of early March 2026, reflecting differing assumptions on Brent crude prices, upstream volume growth, capital returns, and the upcoming Capital Markets Day on 19 March 2026. The following targets summarise forecasts from leading institutions and data services published in February or March 2026.
MarketBeat (consensus, NYSE-listed shares)
MarketBeat reports that analysts covering Eni's NYSE-listed shares (NYSE: E) carry an average 12-month price target of $34.60, alongside an overall Hold-leaning rating profile comprising one Strong Buy, four Buy, six Hold and one Sell. The service notes this consensus sits below the prevailing share price, as brokers weigh Eni's earnings trajectory and capital-return policies against a volatile oil and gas backdrop (MarketBeat, 2 March 2026).
RBC Capital Markets (post-results target raise)
RBC Capital Markets raised its 12-month ENI stock forecast from €17 to €20 ahead of the company's March 2026 strategic plan presentation, while maintaining a Sector Perform rating. The firm cites continued upstream momentum – including exploration-led asset sales, new partnerships, and production growth extending into 2026 – as the basis for the higher target, while noting that recent share price gains and current valuation already reflect much of this positive news (MarketScreener, 27 February 2026).
Investing.com (consensus screen, Milan listing)
Investing.com aggregates 23 analyst estimates for the Milan-listed shares and reports an average 12-month price target of approximately €18.32, with individual forecasts ranging from a low of €14.50 to a high of €22.50 and an overall Buy consensus rating. The dispersion across estimates reflects differing oil price assumptions and varying views on the pace of Eni's decarbonisation and portfolio-simplification execution (Investing.com, 3 March 2026).
TipRanks (Wall Street coverage)
TipRanks collates 12-month targets from Wall Street analysts covering ENI and reports an average of approximately €18.55, with a high forecast of €22.50 and a low of €14.50, alongside a Moderate Buy consensus rating. The platform attributes the spread in estimates to differing assessments of cash-flow resilience and the pace of Eni's energy-transition investments amid shifting commodity-market conditions (TipRanks, 3 March 2026).
J.P. Morgan (house upgrade, Overweight)
J.P. Morgan upgraded Eni to Overweight from Underweight and raised its price target to €22 from €17.50, setting the target on a June 2027 horizon as an equal-weighted blend of sum-of-the-parts and 2027 price-to-earnings. The bank cites top-quartile oil and gas leverage through multi-year volumetric growth and a relative valuation discount to European sector peers under $70-plus Brent price decks as the primary drivers of the revision (Investing.com, 2 March 2026).
Predictions and third-party forecasts are inherently uncertain, as they cannot fully account for unexpected market developments. Past performance is not a reliable indicator of future results.
ENI stock price: Technical overview
The ENI stock price trades at €19.87 as of 3:17pm UTC on 4 March 2026, holding well above its key moving-average cluster – the 20/50/100/200-day SMAs at approximately €18.66 / €17.36 / €16.59 / €15.49 – with all four averages stacked in a bullish sequence beneath current price, keeping the medium-term trend constructive.
Momentum is stretched: the 14-day RSI reads 73.8, firmly in overbought territory, which typically prompts caution on fresh breakout attempts while price holds above the MA band. The ADX at 46.8 confirms a well-established directional trend is in force, adding weight to the broader upward structure.
To the upside, the classic R1 at €20.77 is the immediate reference to watch; a convincing daily close above that level would put the R2 area near €21.88 back in view. Beyond there, the R3 at €25.02 represents the outer extension if buying pressure were to extend on a sustained basis.
On pullbacks, the classic pivot at €18.74 offers the first meaningful support, sitting close to the 20-day SMA shelf at €18.66. Losing that confluence zone would risk a move towards the S1 level at €17.63, and below there the 50-day SMA near €17.36 represents the next structural shelf (TradingView, 4 March 2026).
This is technical analysis for informational purposes only and does not constitute financial advice or a recommendation to buy or sell any instrument.
Eni share price history (2024–2026)
ENI’s stock price traded around €14.52 in early March 2024, broadly rangebound through the first half of that year before softening into year-end, closing 2024 at €13.10 on 30 December.
The stock opened 2025 at €13.50 and spent much of Q1 moving sideways near that level, before a sharp sell-off in early April dragged the price down to a two-year low of €11.28 on 9 April 2025 – a move that coincided with a broad energy-sector pullback and global macro uncertainty. ENI recovered steadily through the rest of 2025, climbing back through €14 by October and closing the year at €16.18 on 30 December, a gain of roughly 19.9% across 2025.
The rally extended into 2026, with ENI opening the year at €16.44 on 2 January and pushing higher through February as Brent crude rose and the company posted a strong set of Q4 results. The stock touched €20.82 intraday on 2 March 2026, its highest point in the two-year window.
ENI closed at €19.95 on 4 March 2026 – approximately 21.4% up year to date and 50.6% higher year on year.
Past performance is not a reliable indicator of future results. Share prices are indicative and may differ from live market prices.
Eni (ENI): Capital.com analyst view
Eni's share price has recovered over the past twelve months, climbing from a two-year low of €11.28 in April 2025 to trade near €19.87 as of 4 March 2026 – a move supported by stronger-than-expected upstream production, a series of analyst upgrades, and higher Brent crude prices. The Q4 2025 results, which showed a 35% rise in adjusted net profit, added further momentum, while the upcoming Capital Markets Day on 19 March 2026 keeps near-term attention focused on management's 2026–2029 strategic priorities. That said, Eni's fortunes remain closely tied to oil and gas price movements; a reversal in Brent – whether driven by demand weakness, OPEC+ supply increases, or a stronger US dollar – could weigh on earnings expectations and, in turn, on the share price.
The dividend programme and active buyback activity offer a degree of income support, which some market participants view as a stabilising factor. However, the pace of the energy transition introduces longer-term uncertainty around the value of Eni's legacy hydrocarbon assets, and regulatory or geopolitical developments across its operating regions – including North Africa and the Middle East – carry the potential to affect production and earnings expectations in either direction.
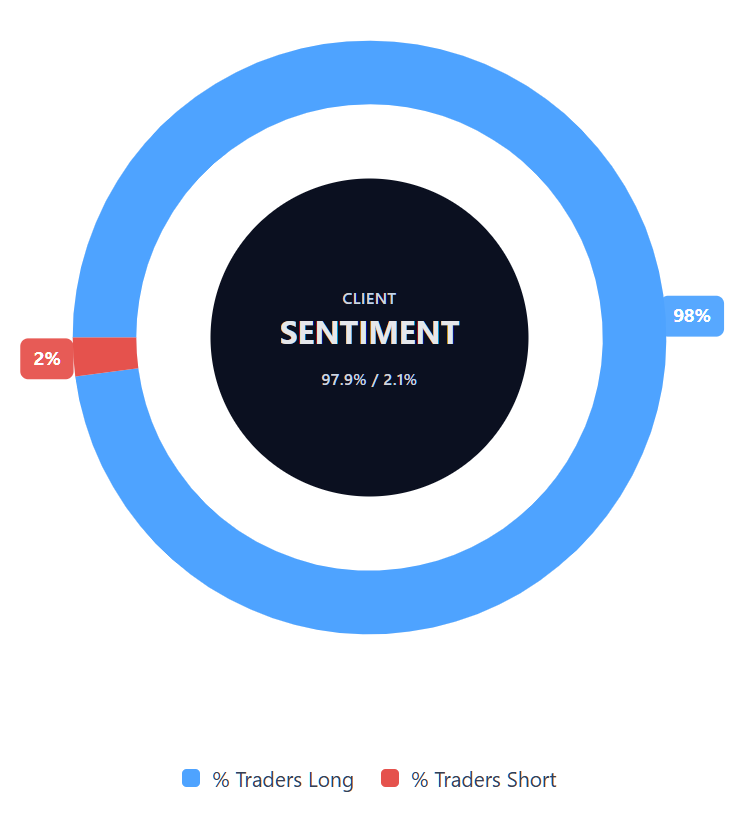
Capital.com’s client sentiment for Eni CFDs
As of 4 March 2026, Capital.com client positioning in Eni CFDs is skewed towards longs: 97.9% buyers vs 2.1% sellers, putting buyers ahead by 95.8 percentage points and placing sentiment firmly in one-sided territory towards longs. This snapshot reflects open positions on Capital.com and can change rapidly as market conditions evolve.
Summary – Eni 2026
- Eni (ENI) trades at €19.87 as of 3:17pm UTC on 4 March 2026, up from a two-year low of €11.28 in April 2025.
- All key moving averages – 20/50/100/200-day SMAs – are stacked below price, with RSI at 73.8 indicating stretched momentum in an established uptrend (ADX: 46.8).
- classic pivot resistance sits at R1 €20.77, with initial downside support at the Pivot Point (€18.74) and the 20-day SMA shelf near €18.66.
- Key price drivers include Brent crude trajectory, Eni's Q4 2025 earnings beat, analyst upgrades from JPMorgan, Citi, UBS, and RBC, and the 19 March Capital Markets Day.
Past performance is not a reliable indicator of future results.
FAQ
Who owns the most Eni stock?
What is the 5 year Eni share price forecast?
Is Eni a good stock to buy?
Could Eni stock go up or down?
Should I invest in Eni stock?
Can I trade Eni CFDs on Capital.com?
Yes, you can trade Eni CFDs on Capital.com. Trading share CFDs lets you speculate on price movements without owning the underlying asset and to take long or short positions. However, contracts for difference (CFDs) are traded on margin, and leverage amplifies both profits and losses. You should ensure you understand how CFD trading works, assess your risk tolerance, and recognise that losses can occur quickly.