Enel stock forecast: 2025 EBITDA, Italy energy decree
Enel (ENEL) is an Italian utility listed in Milan; its shares have moved after preliminary 2025 EBITDA of €22.9bn and Italy’s February 2026 Energy Decree, alongside a buyback and the 2026–2028 plan. Past performance is not a reliable indicator of future results. Explore third-party ENEL targets.
Enel S.p.A. (ENEL) is trading at €9.53 as of 10:56am UTC on 11 March 2026, within an intraday range of €9.415–€9.625, as the stock consolidates below its two-year high of €10.33, reached on 27 February 2026 after a post-Capital Markets Day rally through February. Past performance is not a reliable indicator of future results.
Price action reflects several converging factors. Enel’s preliminary 2025 full-year ordinary EBITDA of €22.9 billion came in at the lower bound of its €22.9–€23.1 billion guidance range, supported by international activities alongside lower margins in Italy (Reuters, 5 February 2026). Italy’s Energy Decree, approved by cabinet in February 2026, strips carbon costs from power bills and sent Italian year-ahead power prices down nearly 15% in the month, raising margin-compression concerns for integrated utilities including Enel (Bloomberg, 18 February 2026).
European equities also remained under pressure after the STOXX 600 fell 3.1% on 3 March 2026 amid escalating Middle East conflict, with a partial rebound under way on 10–11 March (Reuters, 6 March 2026). Enel’s on-market share buyback programme, with purchases reported through late February 2026, continues to provide a technical reference point alongside the company’s announced 2026–2028 Strategic Plan, which targets adjusted EBITDA of €23.1–€23.6 billion for the current year (Enel, 3 March 2026).
Enel stock forecast 2026–2030: Third-party price targets
As of 11 March 2026, third-party Enel stock predictions offer a range of views on Enel (ENEL), with price targets and ratings shaped primarily by the company’s Capital Markets Day on 23 February 2026, its 2026–2028 Strategic Plan, and the European utility sector backdrop.
Barclays (post-CMD rating)
Barclays analyst Peter Crampton raises Enel’s 12-month price target to €11 and reiterates an Overweight rating, describing the Capital Markets Day as having 'positively delivered', with Enel’s 2026 EPS guidance of €0.72–€0.74 running approximately 2% ahead of prior consensus. The bank cites stronger-than-expected earnings targets and upward estimate revisions from the 2026–2028 plan as the primary basis for the upgraded objective (MarketScreener, 23 February 2026).
Yahoo Finance (narrative and consensus shift)
Yahoo Finance notes that analysts following Enel lift the consensus fair value price target from €9.42 to €9.68, a revision of approximately 2.7%, reflecting updated views following the company’s strategic plan presentation. The service attributes the upward shift to revised earnings assumptions across contributing brokers, with the adjustment representing a modest re-rating rather than a broad-based upgrade cycle (Yahoo Finance, 7 March 2026).
MarketBeat (OTC consensus and rating)
MarketBeat records a consensus rating of Reduce on Enel’s US-listed line (ENLAY), after one Buy, six Hold and two Sell ratings, with Barclays reiterating Overweight amid the post-CMD trading session. The service flags elevated leverage (debt-to-equity ratio of 1.17) and tighter liquidity (current ratio 0.81) as the fundamental context underpinning more cautious broker stances, with ENLAY trading above its 50-day moving average of $10.83 and its 200-day moving average of $10.11 at the time of capture (MarketBeat, 27 February 2026).
The Globe and Mail (Jefferies broker note)
The Globe and Mail reports that Jefferies analyst Arturo Murua maintains a Buy rating on Enel with a 12-month price target of €10 following the strategic plan update. The firm’s stance reflects its assessment of Enel’s cash generation capacity and earnings delivery within the European integrated utilities sector (The Globe and Mail, 24 February 2026).
TradingView (analyst consensus snapshot)
TradingView aggregates analyst price targets for Enel at an average of €9.86, with a high estimate of €11.50 and a low of €8 across contributing brokers, captured in early March 2026. The platform’s blended consensus reflects the spread of individual models weighing Enel’s strategic plan execution, balance-sheet trajectory and regulatory risk across its Italian and international operations (TradingView, 5 March 2026).
Predictions and third-party forecasts are inherently uncertain, as they cannot fully account for unexpected market developments. Past performance is not a reliable indicator of future results.
ENEL stock price: Technical overview
The ENEL stock price trades at €9.53 as of 10:56am UTC on 11 March 2026, sitting just above the cluster of its 20/50/100/200-day SMAs at roughly €9.54 / €9.37 / €9.07 / €8.52, with the 100- and 200-day SMAs providing a broader longer-term support shelf well below the current price. The 20-day SMA has crossed below the 50-day SMA, which removes the 20-over-50 bull alignment and keeps the near-term picture mixed. The 14-day RSI registers 49.6, a neutral reading that points to a lack of directional conviction, while the ADX(14) at 17.3 indicates a weak and non-trending environment.
On the topside, the classic R1 pivot at €10.73 is the first reference of note; a daily close above that level would put the R2 pivot near €11.27 into view. The round €10 figure sits within that range and may act as an intermediate reference given the concentration of broker price targets in that area.
On pullbacks, the classic pivot (P) at €9.77 offers the first area of potential support, sitting fractionally above the current last price and likely to serve as a near-term orientation level. A slip below the €9.54 20-day SMA shelf would bring the S1 pivot at €9.23 into focus, with the 50-day SMA at €9.37 as an intermediate reference. A sustained move below the 50-day SMA would risk a deeper move towards the S1 area (TradingView, 11 March 2026).
This is technical analysis for informational purposes only and does not constitute financial advice or a recommendation to buy or sell any instrument.
Enel share price history (2024–2026)
ENEL’s stock price traded around €6.18 in mid-March 2024, then spent much of the rest of that year consolidating in the €6.50–€7.35 range before finishing 2024 at €6.90 – a modest but steady year for the Italian utility group.
2025 was more eventful. The stock dipped to a low of €6.82 on 9 April 2025, as global equity markets sold off sharply on US tariff concerns, before recovering through the second half of the year. A steady grind higher through the summer and autumn months saw ENEL close 2025 at €8.88, up approximately 28.6% on the year – its strongest annual performance in the two-year window.
The momentum carried into early 2026. Enel’s Capital Markets Day on 23 February 2026 delivered a new €53 billion strategic plan, sending the stock to a two-year high of €10.25 on 27 February 2026. It has since pulled back, with a broader European equity market retreat weighing on broader risk appetite into March.
ENEL closed at €9.53 on 11 March 2026, which is approximately 5.8% up year to date and 37.0% up year on year.
Past performance is not a reliable indicator of future results. Share prices are indicative and may differ from live market prices.
Enel (ENEL): Capital.com analyst view
Enel’s price performance over the past two years reflects a notable re-rating, with the stock climbing from around €6.18 in mid-March 2024 to a two-year high of €10.25 on 27 February 2026, supported by stronger-than-expected 2025 earnings, a well-received Capital Markets Day, and renewed investor interest in European integrated utilities. The company’s €53 billion 2026–2028 strategic plan has provided a clearer earnings roadmap, and buyback activity has offered an additional technical support layer. However, elevated debt levels and a debt-to-equity ratio above 1.0 remain a structural consideration, and Italy’s recent Energy Decree – which strips carbon costs from power bills – introduces margin-compression risk that could weigh on domestic earnings assumptions.
The pullback from the February peak to current levels near €9.53 illustrates how quickly sentiment can shift when broader European equity markets come under pressure. Constructive arguments centre on execution of the strategic plan and international earnings diversification; counterbalancing factors include regulatory unpredictability across Enel’s operating markets, interest-rate sensitivity given its leverage profile, and the risk that consensus earnings estimates are revised lower if macro conditions deteriorate.
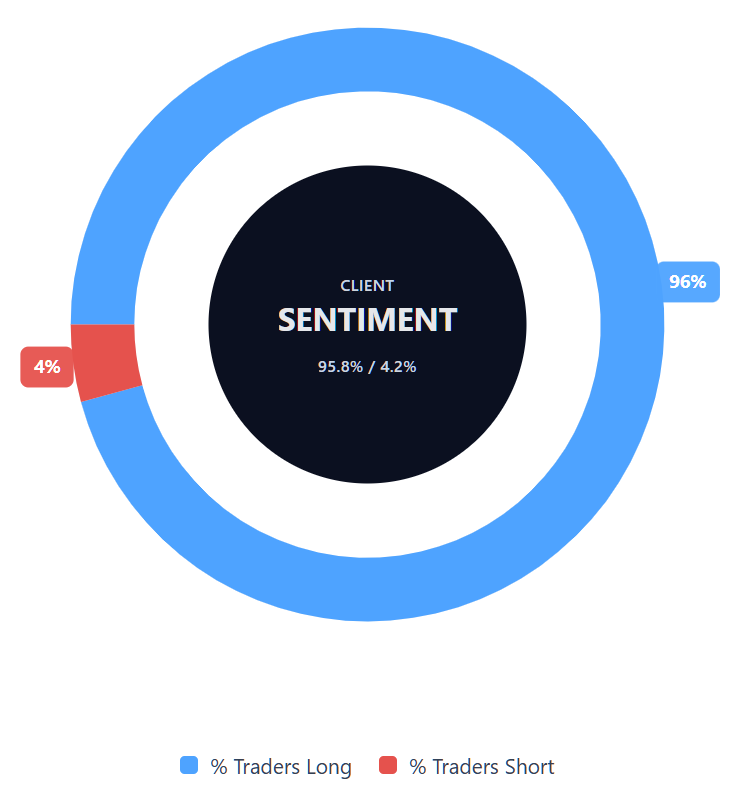
Capital.com’s client sentiment for Enel CFDs
As of 11 March 2026, Capital.com client positioning in Enel CFDs shows 95.8% buyers vs 4.2% sellers, putting buyers ahead by 91.6 percentage points and placing sentiment in a heavily one-sided, long-leaning range. This snapshot reflects open positions on Capital.com and can change rapidly as market conditions evolve.
Summary – Enel 2026
- Enel (ENEL) trades at €9.53 as of 10:56am UTC on 11 March 2026, within an intraday range of €9.415–€9.625, down roughly 7.0% from its two-year high of €10.25 reached on 27 February 2026.
- Over the past two years, ENEL has climbed from around €6.18 in mid-March 2024, closing 2025 at €8.88, representing annual gains of approximately 28.6% last year.
- Technical indicators are mixed: the 14-day RSI sits at 49.6 in neutral territory, the ADX(14) at 17.3 signals a weak trend, and the 20-day SMA has crossed below the 50-day SMA.
- Classic pivot support sits at €9.77, with the 50-day SMA at €9.37 as the next meaningful shelf; R1 at €10.73 is the nearest topside reference on a daily close basis.
- Key price drivers include Enel’s 2026–2028 strategic plan targeting adjusted EBITDA of €23.1–€23.6 billion, its ongoing share buyback programme, and preliminary 2025 results showing ordinary EBITDA of €22.9 billion.
Past performance is not a reliable indicator of future results.
FAQ
Who owns the most Enel stock?
What is the 5 year Enel share price forecast?
Is Enel a good stock to buy?
Could Enel stock go up or down?
Should I invest in Enel stock?
Can I trade Enel (ENEL) CFDs on Capital.com?
Yes, you can trade Enel CFDs on Capital.com. Trading share CFDs lets you speculate on price movements without owning the underlying asset and to take long or short positions. However, contracts for difference (CFDs) are traded on margin, and leverage amplifies both profits and losses. You should ensure you understand how CFD trading works, assess your risk tolerance, and recognise that losses can occur quickly.