Bitcoin price prediction: MicroStrategy’s BTC buys
Bitcoin traded near a six-week high on 16 March 2026 after a sharp intraday rise, with price action shaped by geopolitical tension, short liquidations and continued corporate accumulation.
Past performance is not a reliable indicator of future results. Share prices are indicative and may differ from live market prices. Explore third-party BTC price targets and technical analysis.
Bitcoin (BTC) is trading at $73,581.25 on Capital.com’s quote feed at 11:40am UTC on 16 March 2026, within a session range of $70,730-$74,082.75. Past performance is not a reliable indicator of future results.
The rally reflects a combination of geopolitical, liquidation, and institutional factors. Bitcoin has attracted safe-haven demand amid the ongoing US-Iran conflict, with FxPro chief market analyst Alex Kuptsikevich noting that ‘Bitcoin is beginning to attract attention as a safe-haven asset, rising amid volatility in financial markets’ (Motley Fool Australia, 16 March 2026). A sharp $1,800 surge earlier in the session triggered approximately $113m in short liquidations across major exchanges, which amplified upward momentum (Coinpedia, 16 March 2026). MicroStrategy has also continued its accumulation programme, adding 17,994 BTC in the prior week as part of a stated target of 1 million BTC by end-2026, reinforcing institutional demand signals (Investing.com, 9 March 2026).
Bitcoin price prediction 2026-2030: Analyst price target view
As of 16 March 2026, third-party BTC price predictions span a wide range, shaped by post-halving cycle dynamics, institutional adoption trends, and the macroeconomic backdrop following BTC’s October 2025 all-time high of $126,025. The following summaries draw from leading crypto data and financial media sources.
CoinCodex (algorithmic five-day model)
CoinCodex projected BTC would reach $73,431 by 6 March 2026, representing an 8.38% rise from the then-current price of $66,983, based on its technical indicator model. The algorithmic forecasting service noted bearish overall sentiment at the time, with 90% of indicators signalling negative momentum, while identifying key resistance levels at $68,622, $70,265, and $72,951 (CoinCodex, 1 March 2026).
Changelly (monthly range model)
Changelly places the March 2026 trading range at $72,134-$81,087, with an average of $76,610, based on a model that incorporates 50-day and 200-day moving average readings. The 2026 full-year projection extends the average to $82,193, with the top of the annual range at $93,133, as the model factors in the post-halving supply cycle and sustained institutional demand (Changelly, 15 March 2026).
Coinpedia / Henrik Zeberg (macro cycle view)
Coinpedia reports that macroeconomist Henrik Zeberg, in his March 2026 portfolio outlook, set a primary scenario target of $110,000-$120,000 for BTC, driven by ETF inflows, risk-on sentiment, and continued institutional adoption. Zeberg also outlined a secondary scenario, assigned a 25% probability, projecting an extended range of $140,000-$150,000 if the current cycle extends further (Coinpedia, 2 March 2026).
Yahoo Finance (contributor year-end view)
Yahoo Finance carries a contributor forecast calling for BTC to reach $125,000 by end-2026, citing the asset’s 47% drawdown from its October 2025 peak as the basis for a projected rebound, with the Federal Reserve’s rate trajectory and institutional re-entry named as the primary catalysts. The piece notes that BTC was trading near $67,000 at the time of writing and flags that a return to favour among institutional allocators would be a necessary precondition (Yahoo Finance, 12 March 2026).
Predictions and third-party forecasts are inherently uncertain, as they cannot fully account for unexpected market developments. Past performance is not a reliable indicator of future results.
BTC price: Technical overview
BTC/USD trades at $73,581 as of 11:40am UTC on 16 March 2026, holding above its short-term moving average cluster, with the 10-, 20-, and 30-day SMAs at roughly $70,091, $69,194, and $68,489, respectively. A 20-over-50 alignment remains intact across the SMA family, which keeps the near-term trend constructive. The 50-day SMA at $71,127 provides an additional layer of support beneath the current price, while the 100-day and 200-day SMAs at $80,617 and $93,740, respectively, sit overhead as longer-term resistance levels. The hull moving average (9) at $73,135 and the volume-weighted moving average (20) at $69,078 reinforce the short-term buy bias.
Momentum is upper-neutral to firm. The 14-day RSI reads 59, consistent with a constructive tone while stopping short of stretched territory. The ADX (14) at 25 indicates a developing rather than entrenched trend, suggesting directional momentum is present but not yet firmly established.
On the topside, the classic R1 pivot at $77,561 is the first meaningful reference point. A daily close above that level would put the R2 area near $88,138 back in view over the medium term. The $75,000 round figure, sitting within 2% of the current price, also warrants attention as an interim congestion zone ahead of R1.
On pullbacks, initial support rests at the classic pivot (P) of $68,746, closely flanked by the 20-day and 30-day SMA zone in the $68,489-$69,194 band. Losing that cluster would expose S1 at $58,169, while the 100-day SMA at $80,617 remains the dominant overhead resistance rather than a downside reference at current levels. A sustained move back below the 50-day SMA at $71,127 would blunt the near-term setup and could lead to a move towards the pivot support band (TradingView, 16 March 2026).
This is technical analysis for informational purposes only and does not constitute financial advice or a recommendation to buy or sell any instrument.
Bitcoin price history (2024–2026)
BTC/USD opened March 2024 trading near $68,000, already well above its 2022-2023 lows, and went on to close 2024 at $93,405.95. The year was shaped by the April 2024 halving, the launch of US spot Bitcoin ETFs, and a sharp post-US election rally that pushed prices from around $69,000 on 5 November to above $90,000 within a week.
The asset peaked in 2025 with an intraday high of $126,287.15 on 6 October, before pulling back through year-end to close 2025 at $87,524.25, a 6.3% decline from the 2024 close despite the mid-year record. A further sell-off into early 2026, including a sharp single-day drop from $75,689 to $62,829 on 5 February 2026 amid tariff-driven risk aversion, extended the drawdown.
BTC is trading near $73,670 on 16 March 2026, approximately 15.8% down year to date and 10.8% lower year on year.
Past performance is not a reliable indicator of future results. Share prices are indicative and may differ from live market prices.
Capital.com analyst view: Bitcoin
Bitcoin’s price trajectory over the past two years reflects the asset’s characteristic blend of sharp rallies and steep corrections. The April 2024 halving, which reduced new supply entering the market, combined with the launch of US spot Bitcoin ETFs and renewed institutional demand, drove BTC to an intraday record above $126,000 in October 2025. However, that same institutional sensitivity cuts both ways. Concentrated positioning, macro risk-off episodes, and tariff-driven market stress contributed to a drawdown of roughly 42% from that peak to early-2026 lows, illustrating how quickly sentiment can reverse.
More recently, BTC has recovered towards the $73,000-$74,000 range, supported by safe-haven demand amid geopolitical tensions and a fresh wave of short liquidations. Whether that recovery is sustained remains an open question. Structural tailwinds such as fixed supply, growing adoption, and ongoing institutional accumulation provide a constructive backdrop, while regulatory uncertainty, macroeconomic headwinds, and the asset’s historically high volatility continue to present meaningful downside risks. The balance between these competing forces is likely to remain the defining feature of the BTC market through the remainder of 2026.
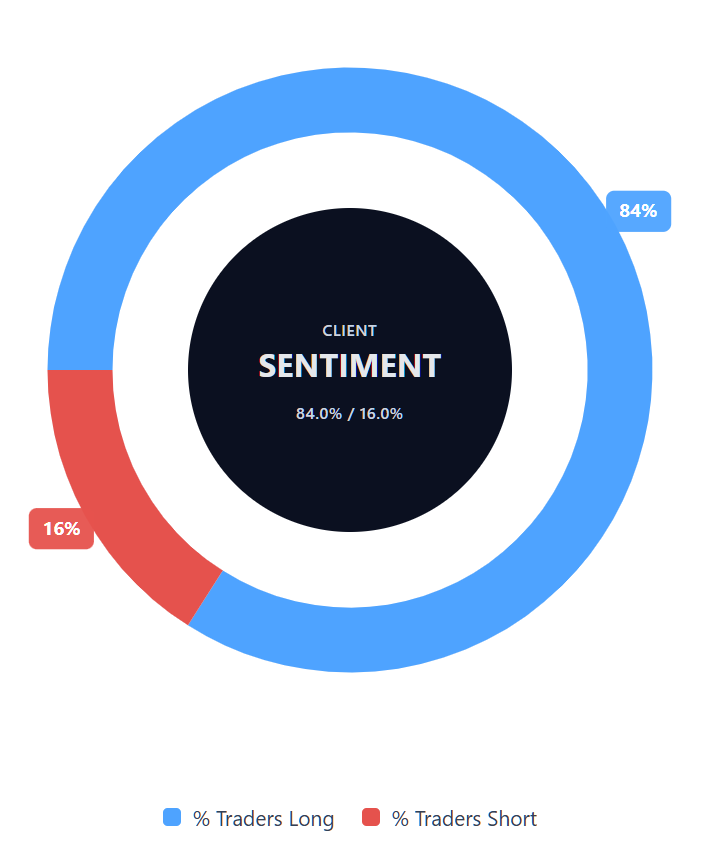
Capital.com’s client sentiment for Bitcoin CFDs
As of 16 March 2026, Capital.com client positioning in Bitcoin CFDs reads 84% buyers versus 16% sellers, which puts buyers ahead by 68 percentage points and places sentiment firmly in one-sided long positioning territory. This snapshot reflects open positions on Capital.com and can change.
Summary – Bitcoin (2026)
- BTC trades at $73,581.25 as of 11:40am UTC on 16 March 2026, down approximately 15.8% year to date and approximately 10.8% year on year.
- The 14-day RSI reads 59 (upper-neutral), and the ADX at 25 indicates a developing but not yet established trend. The 100-day and 200-day SMAs at $80,617 and $93,740 remain overhead resistance.
- Key drivers include geopolitical safe-haven demand amid the US-Iran conflict, approximately $113m in short liquidations, and continued institutional accumulation by Strategy.
- The macro backdrop features a softening US dollar and sensitivity to Federal Reserve policy direction, both of which may affect risk-asset demand in either direction.
Past performance is not a reliable indicator of future results.
FAQ
What is the latest Bitcoin crypto price prediction?
Who owns the most Bitcoin?
How many Bitcoins are there?
Could Bitcoin’s price go up or down?
Should I invest in Bitcoin?
Can I trade Bitcoin CFDs on Capital.com?
Yes, you can trade Bitcoin CFDs on Capital.com. Trading crypto CFDs lets you speculate on price movements without owning the underlying asset and to take long or short positions. However, contracts for difference (CFDs) are traded on margin, and leverage amplifies both profits and losses. You should ensure you understand how CFD trading works, assess your risk tolerance, and recognise that losses can occur quickly.