Apple stock forecast: Q1 revenue up 16% YoY
Apple Inc. is a US-listed technology company. In Q1 2026, it reported revenue of $143.8bn and EPS of $2.84, while markets also monitor its AI roadmap and Services performance. Explore third-party AAPL price targets and technical analysis.
Apple Inc (AAPL) is trading around $272.01 in early European hours on 27 February 2026, moving within an intraday range of $270.85-$274.76, according to Capital.com’s feed at 7:09am (UTC). The price action keeps the shares broadly steady following gains earlier in February, with current levels near the middle of today’s trading range. Past performance is not a reliable indicator of future results.
Apple reported fiscal Q1 2026 revenue of about $143.8bn, up roughly 16% year on year, with diluted earnings per share of around $2.84 and net income near $42.1bn, supported by robust iPhone and Services growth (Apple, 29 January 2026). Trading activity also reflects continued focus on Apple’s hardware and AI roadmap, as recent coverage points to projects in AI-enabled wearables, including smart glasses and camera-equipped AirPods, alongside efforts to expand Siri and Apple Intelligence features (The Verge, 17 February 2026).
Apple stock forecast 2026–2030: Third-party price targets
As of 27 February 2026, third-party Apple stock predictions mostly fall within the high-$280s to mid-$300s. Recent updates cluster around Buy or Moderate Buy ratings, with commentary centred on iPhone demand, Services revenue and AI-related initiatives.
Public.com (consensus overview)
Public.com states that 28 analysts assign Apple a consensus Buy rating with 12-month AAPL stock forecast averaging around $287.95. The platform notes that this aggregate figure reflects Wall Street models incorporating projected revenue from iPhone, Services and newer AI-linked products, set against an already elevated share price (Public.com, 25 February 2026).
MarketBeat (consensus rating)
MarketBeat reports that 36 analysts covering Apple assign a Moderate Buy consensus rating, with an average one-year price target of about $291.70. The publication states that this mid-$290s estimate reflects recent research notes in which analysts weigh earnings momentum against macroeconomic risks and competitive pressures in large-cap technology (MarketBeat, 9 February 2026).
TipRanks (consensus snapshot)
TipRanks states that Wall Street analysts hold a Moderate Buy consensus on Apple, with a 12-month price target around $305.59. The report indicates that this level reflects expectations for continued iPhone performance and Services expansion, alongside growing attention to Apple’s AI positioning (TipRanks, 2 February 2026).
Bank of America (individual price target)
Bank of America analyst Wamsi Mohan reaffirms a Buy rating on Apple, setting a 12-month price target of $325. This target is based on assumptions of steady device demand and potential earnings growth as AI features expand across Apple’s hardware and services ecosystem (The Globe and Mail, 4 February 2026).
Predictions and third-party forecasts are inherently uncertain, as they cannot fully account for unexpected market developments. Past performance is not a reliable indicator of future results.
AAPL stock price: Technical overview
On the daily chart at 7:09am (UTC) on 27 February 2026, the AAPL stock price trades above its key simple moving average cluster, with the 20/50/100/200-day moving averages around 268/266/267/243. This positioning keeps price action above the broader trend band, while the 20-day average remains above the 50-day average. The 14-day RSI stands near 57, in upper-neutral territory. An ADX reading around 17 suggests a relatively weak trend structure rather than a strongly directional move at this stage.
On the upside, the nearest classic pivot resistance (R1) sits around 277. A sustained daily close above this level would bring the R2 reference near 295 into focus as a potential resistance zone. On pullbacks, initial support appears near the classic pivot around 260. The 100-day simple moving average in the mid-$260s may act as a secondary support area, while a move below that zone would expose the S1 level near 243 (TradingView, 27 February 2026).
This technical analysis is provided for informational purposes only and does not constitute financial advice or a recommendation to buy or sell any instrument.
Apple share price history (2024–2026)
AAPL’s stock price has risen over the past two years, moving from around $180 at the end of February 2024 to approximately $272 by 27 February 2026. During 2024, the stock advanced from the high-$100s to the low-$200s by mid-year, breaking above $200 in June before consolidating in the mid-$220s to $230s later in the summer.
After trading largely in the low- to mid-$200s during the final quarter of 2024, AAPL experienced renewed upward momentum in 2025. The price moved from roughly $190-$200 in April through the low-$200s in early summer and towards the mid-$240s to $250s by year-end. In early 2026, the stock extended these gains, with prices generally in the mid-$250s to mid-$270s range and a recent high near $288 in early December 2025. As of 27 February 2026, the price trades around $272.
Past performance is not a reliable indicator of future results. Share prices are indicative and may differ from live market prices.
Apple (AAPL): Capital.com analyst view
Over the past two years, Apple’s share price has followed a broadly upward trajectory within a constructive range, interspersed with periods of consolidation. This trend has coincided with strong earnings releases and sustained investor interest in large-cap technology. However, the price history also shows periods of volatility, particularly when broader technology sentiment shifts or valuation concerns emerge.
Looking ahead, recurring Services revenue, product-cycle developments and AI-related initiatives remain central themes in market commentary. At the same time, softer consumer demand, execution risks tied to new products, regulatory developments or changes in interest rate expectations could influence price performance. As with any equity, Apple’s share price may react to both company-specific updates and wider macroeconomic conditions.
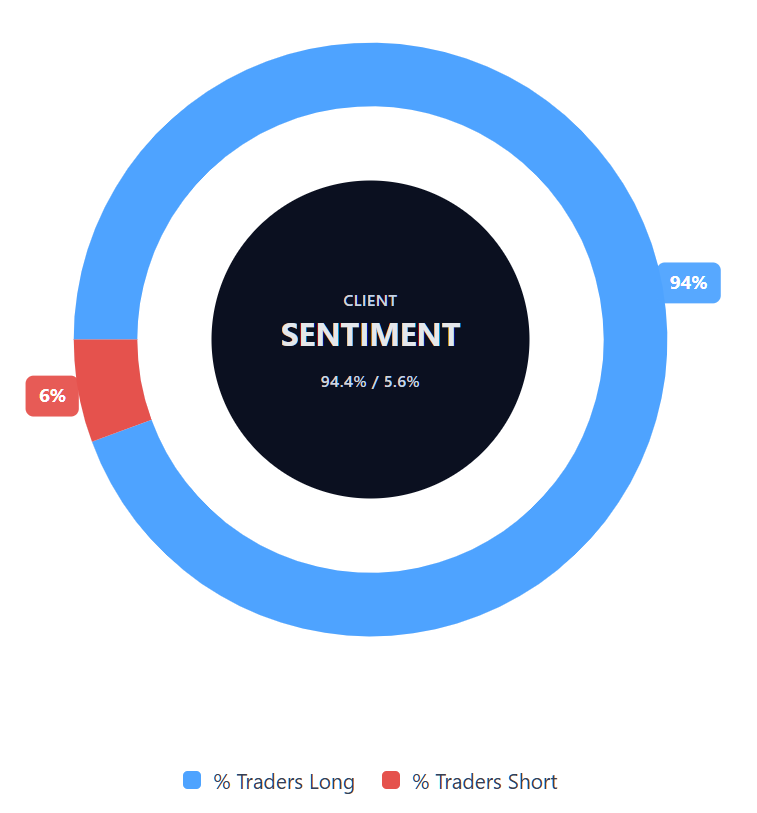
Capital.com’s client sentiment for Apple CFDs
As of 27 February 2026, Capital.com client positioning in Apple CFDs shows a majority of open positions on the long side, with 94.4% of clients holding buy positions and 5.6% holding sell positions at the time of writing. This distribution reflects client exposure on the platform and may change as market conditions evolve.
Summary – Apple 2026
- As of 7:09am (UTC) on 27 February 2026, Apple trades near $272.01, up from the high-$100s in early 2024 following several consolidation phases.
- Daily technical indicators show the price above its 20/50/100/200-day moving averages, with RSI in upper-neutral territory and trend strength measured by ADX remaining modest.
- Key factors in recent market commentary include double-digit revenue growth, continued iPhone and Services performance, and evolving expectations around Apple’s AI-related hardware and software initiatives.
- Analyst price targets published in February 2026 range from the high-$280s to the mid-$300s, while at least one Neutral rating sits below current levels, illustrating a spread of views.
Past performance is not a reliable indicator of future results.
FAQ
Who owns the most Apple stock?
Apple’s largest shareholders typically include major institutional investors, such as asset managers and index fund providers, alongside company insiders. Firms such as Vanguard and BlackRock have historically ranked among the top holders, largely due to Apple’s weighting in global equity indices. Ownership levels tend to change over time as funds rebalance portfolios or adjust exposure. Regulatory filings, including those submitted to the US Securities and Exchange Commission (SEC), offer the most up-to-date breakdown of significant shareholdings.
What is the 5-year Apple share price forecast?
Five-year AAPL stock forecasts vary widely and depend on assumptions about revenue growth, profit margins, product cycles and broader economic conditions. While some analysts publish long-term projections, these estimates rely on models that may adjust as new information becomes available. Over extended periods, factors such as consumer demand, competition, regulation and innovation can shape performance. Long-term forecasts therefore represent scenarios rather than precise predictions.
Is Apple a good stock to buy?
Whether Apple is a suitable stock depends on your financial objectives, risk tolerance and time horizon. The company has reported strong revenues and maintains a significant global presence, but its share price can fluctuate in response to earnings results, valuation considerations or wider market conditions. Investors and traders often assess fundamentals, technical indicators and macroeconomic data before making decisions. This information is provided for educational purposes only and does not constitute investment advice.
Could Apple stock go up or down?
Apple’s share price can move in either direction, including over short timeframes. Company-specific developments, such as earnings announcements or product launches, may influence trading activity. At the same time, broader factors – including interest rates, economic data and global risk sentiment – can affect large-cap technology stocks. Past performance does not guarantee future results, and volatility remains a normal feature of equity markets.
Should I invest in Apple stock?
Deciding whether to invest in Apple requires careful consideration of your personal circumstances and overall strategy. Some market participants focus on long-term fundamentals, while others trade shorter-term price movements using shares or CFDs. Each approach carries risk, including the possibility of losing capital. You may wish to conduct your own research and, where appropriate, seek independent financial advice before committing funds.
Can I trade Apple CFDs on Capital.com?
Yes, you can trade Apple CFDs on Capital.com. Trading share CFDs lets you speculate on price movements without owning the underlying asset and to take long or short positions. However, contracts for difference (CFDs) are traded on margin, and leverage amplifies both profits and losses. You should ensure you understand how CFD trading works, assess your risk tolerance, and recognise that losses can occur quickly.