Apple stock forecast: Tim Cook quells retirement rumours
Apple is a Nasdaq-listed technology company. Its shares remain in focus after record fiscal Q1 2026 revenue, while markets also monitor Siri development, supply chain costs and Fed policy. Past performance is not a reliable indicator of future results. Explore third-party AAPL price targets.
Apple Inc (AAPL) is trading at $254.75 in early European trading at 11:37am UTC on 18 March 2026, within an intraday range of $251.31–$255.13. Past performance is not a reliable indicator of future results.
Sentiment on AAPL is shaped by several concurrent factors. The Federal Reserve concludes its two-day FOMC meeting on Wednesday, with CME FedWatch pricing in a near-certain rate hold at the current 3.50%–3.75% target range (CNBC, 17 March 2026). The Fed will also release updated economic projections, and any shift in tone around future cuts could weigh on large-cap technology valuations (Forbes, 5 March 2026).
Apple CEO Tim Cook dispelled retirement rumours on 17 March 2026, removing a headline overhang from the stock (AppleInsider, 17 March 2026), while the broader macro backdrop remains unsettled, as the Strait of Hormuz closure has pushed oil prices back above $100 a barrel and raised energy cost concerns across the economy (Business Insider, 16 March 2026). The company’s fiscal Q1 2026 record revenue of $143.8bn and diluted EPS of $2.84 continue to provide a fundamental reference point, though ongoing questions around Siri AI development timelines and supply chain costs remain in focus (Yahoo Finance, 30 January 2026).
Apple stock forecast 2026–2030: Third-party price targets
As of 18 March 2026, third-party Apple stock predictions reflect a broad spread of views, shaped by the company’s fiscal Q1 2026 earnings beat, the AI hardware upgrade cycle narrative, Siri development concerns, and the wider macroeconomic backdrop, including trade policy and Federal Reserve guidance. The following targets summarise leading analyst and consensus estimates.
Public.com (consensus overview)
Public.com aggregates ratings from 28 analysts and places the consensus price target at $288.30, with a Buy consensus rating. The breakdown shows 36% strong buy, 32% buy, 21% hold, and 11% sell, with bulls pointing to Q1 revenue of $143.8bn and 23.3% iPhone sales growth, while bears flag Siri AI delays and continued competitive pressure from Alphabet (Public.com, 18 March 2026).
MarketBeat (consensus snapshot)
MarketBeat reports that 36 analysts covering Apple assign a consensus ‘Moderate Buy’ rating with an average 12-month AAPL stock forecast of $297.58; the individual targets range from $170 to $350. The aggregate reflects 22 buys, 12 holds, 1 sell and 1 strong buy, as analysts weigh the launch of the low-cost MacBook Neo and AI-focused Mac lineup against broader market volatility and geopolitical risk (MarketBeat, 6 March 2026).
Stifel Nicolaus (broker note)
Stifel Nicolaus set a 12-month price target of $330 on AAPL, representing one of the more constructive calls among major brokerages at the time. The firm’s note cited the company’s hardware refresh cycle and services revenue momentum as key supports, with AI-driven Mac demand flagged as a near-term catalyst (Cbonds, 2 March 2026).
Wedbush (house view)
Wedbush analyst Daniel Ives raised AAPL’s price target to a Street-high $350, reiterating an Outperform rating, as the firm cited Apple’s expanding M5-powered Mac lineup as a likely trigger for an AI hardware upgrade cycle. Ives noted that roughly 50% of recent Mac buyers are first-time purchasers, which the firm views as evidence of an addressable market expansion that could support multi-quarter revenue upside (GuruFocus, 6 March 2026).
Predictions and third-party forecasts are inherently uncertain, as they cannot fully account for unexpected market developments. Past performance is not a reliable indicator of future results.
AAPL stock price: Technical overview
The AAPL stock price trades at $254.75 as of 11:37am UTC on 18 March 2026, sitting below its key moving-average band. The 20-day, 50-day and 100-day SMAs cluster tightly between $262 and $267, with all short- to medium-term averages above price and generating sell signals. The 200-day SMA at $246.12 and the 200-day EMA at $251.25 represent the nearest long-term support below the current price, and the stock is trading between that long-term shelf and the underside of the moving-average band.
Momentum is soft but not at an extreme: the 14-day RSI sits at 40.78, a lower-neutral reading that reflects subdued buying pressure without yet signalling oversold territory. The ADX at 19.63 remains below 25, indicating that the current directional move lacks the intensity of an established trend, which leaves price vulnerable to choppy, range-bound conditions near this band.
On the topside, the classic pivot point at $266.85 is the first reference to clear; a convincing daily close above this level would put the R1 level at $278.24 back in view. Should price recover through R1 on a sustained basis, R2 near $292.30 comes into focus as the next meaningful reference.
On pullbacks, the 200-day EMA near $251.25 provides initial dynamic support, with the 200-day SMA at $246.12 acting as the broader long-term shelf just below. Losing the $246 area on a daily close would weaken the longer-term trend structure and risk a deeper move toward the S1 classic pivot at $252.79, and then toward the S2 level at $241.39 (TradingView, 18 March 2026).
This is technical analysis for informational purposes only and does not constitute financial advice or a recommendation to buy or sell any instrument.
Apple share price history (2024–2026)
Apple (AAPL) is listed on the Nasdaq and has long been one of the most widely held stocks globally. Over the past two years, the share price has moved through several distinct phases, shaped by earnings results, AI narratives, tariff concerns, and broader market conditions.
AAPL’s stock price opened March 2024 near $175, a level that now looks modest against where the stock would trade just over a year later. The shares climbed steadily through mid-2024, crossing $200 for the first time in the period in late June 2024, before reaching a local high of around $236.33 on 15 July 2024. A brief pullback followed, with the stock touching a short-term low near $196.50 on 5 August 2024 amid a broader market sell-off, before recovering to close the year at $250.73 on 31 December 2024.
2025 opened with further momentum, with AAPL printing a two-year high close of $280.40 on 4 December 2025 before softening into year-end. However, early 2026 brought a sharper reversal: the stock fell from $273.64 on 2 January 2026 to $168.53 on 9 April 2025, before later recovering above $260 by late February 2026. This period was marked by significant volatility linked to tariff announcements.
AAPL closed at $255.05 on 18 March 2026, approximately 6.7% down year to date from the 31 December 2025 close of $272.28, and around 19.5% higher year on year from the 18 March 2025 close of $213.55.
Past performance is not a reliable indicator of future results. Share prices are indicative and may differ from live market prices.
Apple (AAPL): Capital.com analyst view
Apple’s share price has navigated a wide range over the past year, with AAPL trading at $254.75 as of 18 March 2026, down from highs above $284 recorded in December 2025. The stock’s journey reflects competing forces: record fiscal Q1 2026 revenue of $143.8bn and robust services growth have provided a financial foundation, while ongoing questions around the pace of AI development, particularly the delayed rollout of enhanced Siri capabilities, and the impact of US trade tariffs on supply chain costs have weighed on sentiment. Some market participants view Apple’s measured AI spending approach as capital-efficient and margin-protective; others argue that it leaves the company exposed to faster-moving competitors investing more aggressively in the space.
Trade policy continues to present both risk and opportunity. Apple’s accelerated shift of iPhone production towards India has partially insulated the company from China-related tariff exposure, reducing a key supply chain risk. However, further escalation in US-China trade tensions, or an extension of tariffs to currently exempt electronics categories, could materially raise costs and pressure margins. The AI hardware upgrade cycle, driven by the M5 Mac lineup and anticipated iPhone 18 developments, represents a potential positive catalyst, though execution risk remains, and the stock’s relatively elevated valuation leaves limited margin for disappointment.
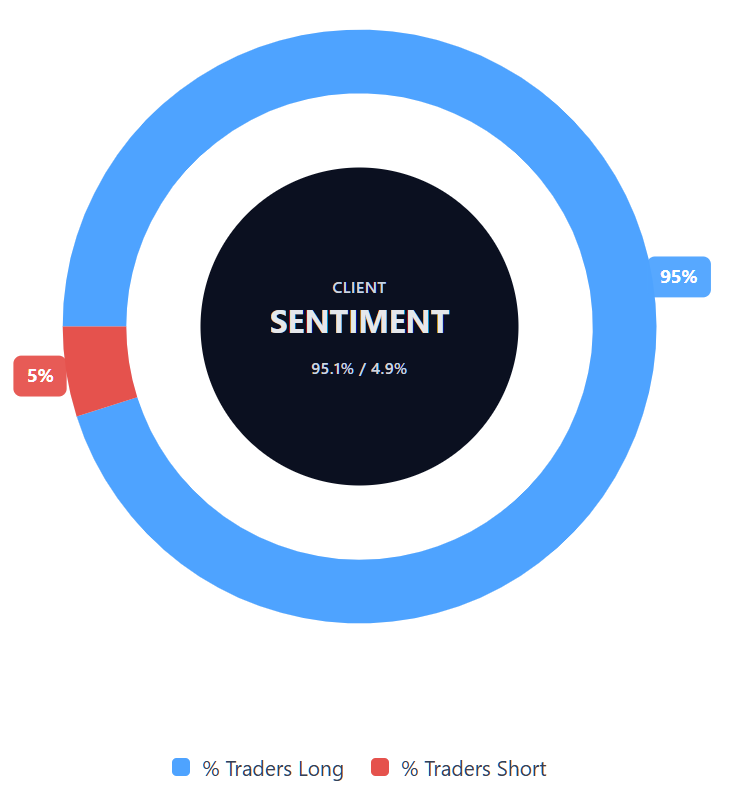
Capital.com’s client sentiment for Apple CFDs
As of 18 March 2026, Capital.com client positioning in Apple CFDs stands at 95.1% long and 4.9% short, placing it firmly in heavy-buy territory and putting buyers ahead by 90.2 percentage points. This snapshot reflects open positions on Capital.com and can change.
Summary – Apple 2026
- As of 11:37am UTC on 18 March 2026, AAPL trades at $254.75, within an intraday range of $251.31–$255.13, and roughly 6.7% down year to date.
- The 14-day RSI at 40.78 reflects lower-neutral momentum, and the ADX at 19.63 indicates that the current directional move lacks the strength of an established trend.
- Key price drivers include the Federal Reserve’s March rate decision, Apple’s record Q1 2026 revenue of $143.8bn, and ongoing questions around Siri AI development timelines.
- Trade policy remains a swing factor, with tariff exposure on China-manufactured products partially offset by Apple’s accelerating shift of iPhone production to India.
- Recent developments include Tim Cook dismissing retirement speculation and oil prices rising above $100 per barrel foll
Past performance is not a reliable indicator of future results.
FAQ
Who owns the most Apple stock?
What is the 5 year Apple share price forecast?
Is Apple a good stock to buy?
Could Apple stock go up or down?
Should I invest in Apple stock?
Can I trade Apple CFDs on Capital.com?
Yes, you can trade Apple CFDs on Capital.com. Trading share CFDs lets you speculate on price movements without owning the underlying asset and to take long or short positions. However, contracts for difference (CFDs) are traded on margin, and leverage amplifies both profits and losses. You should ensure you understand how CFD trading works, assess your risk tolerance, and recognise that losses can occur quickly.