AMD stock forecast: Meta partnership & Q4 results
Advanced Micro Devices is a US semiconductor company supplying AI and data-centre chips, recently reporting $10.27bn in Q4 2025 revenue and announcing a multi-year GPU deployment agreement with Meta Platforms. Explore third-party Advanced Micro Devices price targets and technical analysis.
Advanced Micro Devices Inc (AMD) is trading near $203.17 at 10:18am (UTC) on 27 February 2026, moving within an intraday range of $201.65–$209.65 as the stock consolidates recent volatility around the $200 mark. Past performance is not a reliable indicator of future results.
The move comes amid renewed focus on AMD’s multi-year AI chip agreement with Meta Platforms, under which Meta plans to deploy up to 6 gigawatts of AMD Instinct GPUs as part of its next-generation AI infrastructure build-out (CNBC, 24 February 2026). At the same time, investors are digesting AMD’s latest quarterly results. The company reported fourth-quarter 2025 revenue of $10.27bn and diluted earnings per share of $1.53, alongside guidance for first-quarter 2026 revenue of around $9.8bn, plus or minus $300m (The Wall Street Journal, 4 February 2026).
AMD stock forecast 2026–2030: Third-party price targets
As of 27 February 2026, third-party AMD stock predictions reference AI accelerator demand, data-centre revenue growth, capital expenditure requirements and competitive positioning among large semiconductor peers.
RBC Capital (broker rating update)
RBC Capital maintains a Sector Perform rating on AMD with a $230 price target, describing its stance as balanced in terms of potential upside and risk following the Meta GPU agreement. The broker cites AI-related demand linked to the Meta deal as a potential driver, while flagging valuation levels and execution risks around large-scale deployments as key considerations (Investing.com, 25 February 2026).
Mizuho (single-stock research note)
Mizuho raises its AMD price target to $280 from $275 and reiterates an Outperform rating, implying around 31% upside from the referenced spot level in that note. The bank highlights stronger expectations for AI GPU and data-centre revenue as key drivers, while noting that higher spending requirements and competitive pressures remain central to its risk assessment (MarketBeat, 25 February 2026).
Goldman Sachs (multi-bank target recap)
Goldman Sachs lifts its AMD 12-month price target to $240 from $210, while maintaining a Neutral rating in a broader round-up of broker revisions. The bank points to firmer AI chip demand signals and large contract wins as factors supporting the higher target, but continues to cite valuation metrics and competition as constraints on further re-rating (Yahoo Finance, 27 February 2026).
Stock Analysis (multi-analyst average)
Stock Analysis reports that 33 analysts covering AMD assign a Buy consensus rating, with an average 12-month price target of $261.21. Targets range from $120 on the low end to $358 on the high end. The summary attributes this dispersion to differing assumptions about the pace of AI chip adoption, AMD’s data-centre market share trajectory and broader equity-market conditions (Stock Analysis, 26 February 2026).
Predictions and third-party forecasts are inherently uncertain, as they cannot fully account for unexpected market developments. Past performance is not a reliable indicator of future results.
Advanced Micro Devices stock price: Technical overview
The AMD stock price trades around $203.17 as of 10:18am on 27 February 2026, sitting below a broad daily moving-average band after recent weakness from higher levels. On the daily chart, the simple 20/50/100/200-day moving averages cluster near approximately 213 / 219 / 224 / 186. Price remains below the short- and medium-term averages but above the longer-term 200-day trend line, suggesting mixed momentum signals across timeframes. The 14-day RSI, at around 44, sits in neutral territory, while an ADX reading near 19 indicates a relatively weak trend environment.
On the topside, the nearest classic pivot resistance level appears at R1 around 269, with R2 near 302 coming into view only after a sustained daily close above the initial barrier. On pullbacks, the classic pivot near 235 marks initial support, with the 200-day SMA around 186 representing the next notable moving-average reference. A move below that zone would bring the S1 level near 202 into focus as a further technical reference point (TradingView, 27 February 2026).
This technical analysis is provided for informational purposes only and does not constitute financial advice or a recommendation to buy or sell any instrument.
AMD share price history (2024–2026)
AMD’s stock price has experienced a marked re-rating over the past two years, moving from double-digit levels in early 2025 to trading above $200 by early 2026. The stock closed at $100.15 on 27 February 2025, then advanced through the year, breaking above $200 in late October and finishing 2025 at $214.24 on 31 December.
By 27 February 2026, AMD changed hands at $203.40, below January highs around $259–$260 but still more than double its level a year earlier. This trajectory illustrates both the scale of the upward move and the degree of interim volatility, with sizeable pullbacks occurring within the broader advance.
Past performance is not a reliable indicator of future results. Share prices are indicative and may differ from live market prices.
AMD (Advanced Micro Devices): Capital.com analyst view
Advanced Micro Devices’ share price has undergone a substantial repricing over the past two years, rising from below $100 in early 2025 to trade above $200 for much of early 2026. This move has coincided with increased market attention on AI accelerators and data-centre chips, alongside periods of stronger broader equity sentiment that can influence valuations for growth-oriented technology stocks.
At the same time, the chart shows repeated and, at times, sharp pullbacks from local highs. These retracements suggest that expectations around AI demand, earnings growth and guidance remain sensitive to new data, sector rotation and macroeconomic developments.
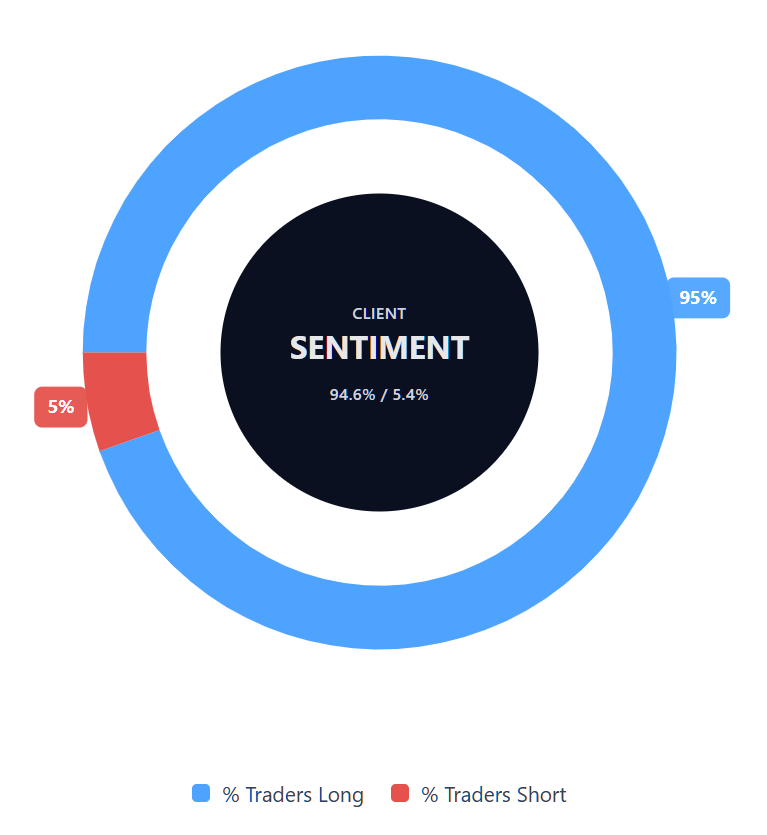
Capital.com’s client sentiment for AMD CFDs
As of 27 February 2026, Capital.com client positioning in AMD CFDs is currently skewed towards long positions, with buyers accounting for 94.6% and sellers 5.4% of open positions. This places buyers ahead by approximately 89.2 percentage points. This data reflects live client positioning on the Capital.com platform and may change over time. It does not indicate future price direction.
Summary – AMD 2026
- As of 10:18am UTC on 27 February 2026, AMD traded near $203.17, more than double its $100.15 close on 27 February 2025.
- Daily technical indicators show price below its 20- to 100-day moving averages but above the 200-day line, with RSI in neutral territory and a relatively weak overall trend reading.
- Key themes include AI accelerator and data-centre demand, hyperscaler capital expenditure, sector rotation within US technology equities and broader equity-market risk appetite.
- Recent developments include AMD’s AI chip agreement with Meta, February earnings and guidance updates, and a series of broker target revisions and rating reiterations.
Past performance is not a reliable indicator of future results.
FAQ
Who owns the most AMD stock?
Advanced Micro Devices is a publicly traded company, so ownership is distributed across institutional investors, asset managers and individual shareholders, rather than a single controlling entity. Large global investment firms such as Vanguard and BlackRock often rank among the largest shareholders, alongside other fund managers and index-tracking vehicles, while senior executives and board members may also hold shares through compensation or incentive arrangements. Ownership levels can change over time as institutions rebalance portfolios, respond to market conditions or adjust exposure to the semiconductor sector.
What is the five-year AMD share price forecast?
There is no single agreed five-year AMD stock forecast, as most published analyst targets focus on a 12-month horizon and longer-term projections depend on assumptions about AI demand, data-centre expansion, competitive dynamics and broader equity-market conditions. Over a multi-year period, semiconductor cycles, capital-expenditure trends, regulatory developments and macroeconomic factors may all influence performance, meaning that extended forecasts are typically scenario-based rather than fixed price estimates.
Is AMD a good stock to buy?
Whether AMD is considered a ‘good’ stock depends on an individual’s objectives, risk tolerance and investment horizon, as the company operates in segments linked to AI accelerators and data-centre infrastructure but also faces cyclical pressures and competition. Its share price has experienced both strong advances and notable pullbacks, so investors often assess financial performance, valuation metrics, competitive positioning and sector trends before making decisions, rather than relying on a single growth narrative. No share is inherently suitable for every investor profile.
Could AMD stock go up or down?
AMD’s share price, like any listed equity, can move in either direction depending on factors such as earnings results, forward guidance, AI-related demand trends, competitive developments and broader equity-market sentiment. Technical indicators, liquidity conditions and investor positioning may also influence shorter-term price movements, and as recent trading history shows, advances have alternated with corrective phases, reinforcing that multiple outcomes remain possible.
Should I invest in AMD stock?
Deciding whether to invest in AMD stock requires consideration of personal financial circumstances, investment objectives and risk appetite, particularly given the company’s exposure to cyclical industry trends and evolving competitive dynamics. The share price has demonstrated both sustained upward phases and sharp retracements, so investors typically weigh potential growth drivers against valuation sensitivity and macroeconomic risks, and you may wish to seek independent financial advice if you are unsure whether the investment aligns with your situation.
Can I trade AMD CFDs on Capital.com?
Yes, you can trade Advanced Micro Devices CFDs on Capital.com. Trading share CFDs lets you speculate on price movements without owning the underlying asset and to take long or short positions. However, contracts for difference (CFDs) are traded on margin, and leverage amplifies both profits and losses. You should ensure you understand how CFD trading works, assess your risk tolerance, and recognise that losses can occur quickly.