AMD stock forecast: Q1 2026 earnings in focus
Advanced Micro Devices is a US semiconductor company whose near-term outlook is shaped by its AI product roadmap, China export restrictions and Q1 2026 earnings due on 5 May 2026. Explore third-party AMD price targets and technicals. Past performance is not a reliable indicator of future results.
Advanced Micro Devices Inc (AMD) is trading at $324.78 as of 10:07am UTC on 29 April 2026, within an intraday range of $310.95–$335.67. Past performance is not a reliable indicator of future results.
Several concurrent drivers have supported momentum. AMD announced its 'Advancing AI 2026' flagship event, scheduled for 23 July 2026 at San Francisco's Moscone Center, signalling continued investment in its AI infrastructure roadmap, including next-generation Instinct accelerators and EPYC server CPUs (AMD Newsroom, 28 April 2026). The broader semiconductor sector has also benefited from TSMC's Q1 2026 results, which showed 40.6% year-on-year revenue growth to $35.9 billion, reinforcing demand signals for advanced-node AI chips that AMD depends on for production (Manufacturing Dive, 17 April 2026). Meanwhile, US export licensing rules introduced under Section 232 continue to create headwinds for AMD's China-facing MI308 sales, with CEO Lisa Su guiding that affected revenue is limited to approximately $100 million in Q1 2026, with no additional China revenue factored into the outlook beyond that (Benzinga, 4 February 2026). AMD is scheduled to report its Q1 2026 financial results on 5 May 2026 after market close, with consensus revenue expectations of approximately $9.84 billion, representing around 32% year-on-year growth (TrendForce, 4 February 2026).
Third-party AMD outlook: Q1 earnings near as targets split
As of 29 April 2026, third-party AMD stock forecasts for 2026–2030 have shifted materially in the fortnight to 29 April 2026, shaped by AI infrastructure order flow, upcoming Q1 2026 earnings due on 5 May, and a high-profile broker upgrade.
Stifel (buy, target raised to $320)
Stifel raised its AMD price target to $320 from $280, reiterating a buy rating. The firm cited multi-gigawatt strategic AI infrastructure commitments from Meta and OpenAI, a counterseasonal CPU ramp, and the forthcoming MI450 and Helios product launches as incremental tailwinds. It also noted that AMD's stated $20+ long-term EPS target now represents a floor given developments since its announcement (Investing.com, 20 April 2026).
DA Davidson (upgraded to buy, target $375)
DA Davidson upgraded AMD from neutral to buy, setting a new 12-month price target of $375, raised from $220. The firm pointed to AMD's strong earnings execution and accelerating AI and GPU demand as the basis for both the rating change and the sharply higher target, which sits at the top of the current Street range (MarketBeat, 24 April 2026).
MarketBeat (consensus, moderate buy)
MarketBeat reports that 37 analysts carried a buy rating on AMD, with the broad Wall Street consensus target at $291.52 on that date. That figure sits below both the Stifel and DA Davidson calls. The consensus reflects a moderate-buy skew while flagging potential sequential gross-margin pressure and highlighting insider selling as near-term risk factors (MarketBeat, 24 April 2026).
Public.com (consensus, buy, $271.40)
Public.com aggregates 35 analyst ratings, reporting a consensus buy rating and an average 12-month price target of $271.40. The breakdown shows 43% of covering analysts at strong buy and 37% at buy, with the remaining 20% on hold and none at sell, as AMD's AI positioning continues to attract broadly constructive coverage (Public.com, 27 April 2026).
TheStreet (buy consensus, earnings context)
TheStreet notes that AMD's consensus buy rating among 37 analysts carries an average target of $291.52, with Stifel's $320 call described as one of the more aggressive on the Street. The outlet flags that the Q1 2026 earnings report, due on 5 May, represents the next material catalyst, amid a broader sector re-rating following strong AI infrastructure order data and Intel's Q1 results (TheStreet, 21 April 2026).
Predictions and third-party forecasts are inherently uncertain, as they cannot fully account for unexpected market developments. Past performance is not a reliable indicator of future results.
AMD earnings history and upcoming results
AMD is scheduled to report its fiscal Q1 2026 financial results on 5 May 2026 after market close, with a live earnings call to follow (AMD Investor Relations, 8 April 2026). Analyst consensus heading into the print sits at approximately $1.27 earnings per share on revenue of approximately $9.84 billion, which would represent roughly 32% year-on-year revenue growth (MarketBeat, 29 April 2026).
The prior quarter (Q4 2025), reported in February 2026, delivered $1.53 EPS and $10.27 billion in revenue, both ahead of consensus expectations at the time, with AMD's data-centre segment – driven by Instinct GPU and EPYC CPU shipments – cited as the primary growth engine. Management guided Q1 2026 revenue at approximately $9.9 billion (plus or minus $300 million), with gross margin expected near 54% (MarketBeat, 28 April 2026).
Key items the market is likely to focus on include the trajectory of Instinct MI300-series GPU revenue, any update on the MI350 and MI450 roadmap, the scale of export licensing impacts on China-facing sales, and whether full-year guidance reflects confidence in hyperscaler AI capex commitments from Meta and others (TheStreet, 21 April 2026). AMD has noted that revenue affected by US export restrictions on the MI308 variant is limited to approximately $100 million in the near term, though further policy changes could alter that figure (TrendForce, 4 February 2026).
Past performance is not a reliable indicator of future results.
Advanced Micro Devices stock price: Technical overview
The AMD stock price is trading at $324.78 as of 10:07am UTC on 29 April 2026, well above its key moving-average cluster. The 20/50/100/200-day SMAs sit at approximately $264 / $226 / $224 / $208, with a 20-over-50 alignment intact across the SMA family, which points to an established medium-term trend.
Momentum readings from TradingView are stretched: the 14-day relative strength index stands at 73.54, a level that historically characterises an extended trend rather than confirming the near-term direction. The average directional index at 45.29 indicates that an established and well-defined trend is in place, according to TradingView data.
To the upside, the nearest classic pivot reference is R1 at $220.43, already cleared decisively, with R2 at $237.44 also surpassed. The next overhead reference on the classic pivot table is R3 near $270.55, while the current price trades meaningfully above that level. The Hull moving average (9) at $345.57 sits above the last price of $324.78, representing a near-term overhead reference.
On pullbacks, the classic pivot point at $204.33 marks a broad support base, with the 100-day SMA near $224 and the 200-day SMA near $208 forming a deeper moving-average shelf. A retreat towards S1 at $187.32 would represent a more substantial retracement from current levels, according to TradingView pivot data (TradingView, 29 April 2026).
This is technical analysis for informational purposes only and does not constitute financial advice or a recommendation to buy or sell any instrument.
AMD share price history (2024–2026)
AMD’s stock price closed April 2024 at $147.55 and spent much of mid-2024 in the $150–$185 range, supported by broader AI optimism, before a sharp sell-off in late July pulled the stock towards $130 amid wider tech sector rotation. A gradual recovery through the autumn brought AMD back above $260 by late October 2024, coinciding with renewed enthusiasm for data-centre AI spending across the semiconductor sector.
2025 told a more turbulent story. AMD started the year near $120 and drifted lower through the spring, hitting a two-year low around $76 on 8 April 2025, a period that coincided with escalating US tariff announcements and broad risk-off selling across equity markets. The stock recovered steadily through the summer and into the autumn, climbing back towards $260 by early November 2025 before fading again into year-end, closing 2025 at approximately $214.
2026 has been markedly stronger. AMD opened the year near $224, pulled back briefly into late January, then surged through February and into April, reaching a high of $354.95 on 27 April 2026 before easing slightly. The rally has broadly tracked growing hyperscaler AI infrastructure commitments and AMD's own Advancing AI product announcements.
AMD closed at $325.76 on 29 April 2026, approximately 52.1% up year to date and 242.2% up year on year.
Past performance is not a reliable indicator of future results. Share prices are indicative and may differ from live market prices.
AMD (Advanced Micro Devices): Capital.com analyst view
AMD's price performance over the past year reflects the broader rerating of AI semiconductor stocks, with the shares climbing from around $85 in April 2025 to a recent high of $354.95 on 27 April 2026, a gain driven largely by accelerating hyperscaler infrastructure commitments and AMD's expanding footprint in data-centre GPU and CPU markets. The forthcoming ‘Advancing AI 2026’ event, scheduled for July, and the Q1 2026 earnings report due on 5 May have added near-term catalysts that some observers consider supportive of the elevated valuation. However, the stock's sharp climb also leaves it exposed to disappointment if earnings or forward guidance fall short of elevated expectations.
On the risk side, US export licensing restrictions introduced under Section 232 continue to limit AMD's addressable market for its MI-series accelerators in China, representing a tangible revenue constraint that could weigh on sentiment if policy tightens further. Competitive pressure from Nvidia in the AI accelerator space remains a structural headwind, while a potential softening in enterprise IT spending or a broader macro deterioration could affect the demand assumptions that currently underpin bullish price targets across the analyst community.
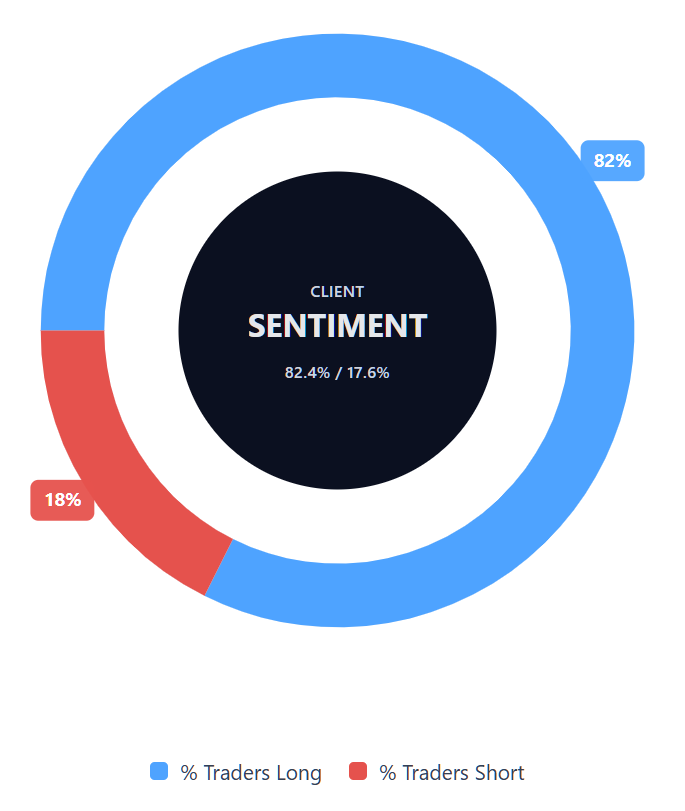
Capital.com’s client sentiment for AMD CFDs
As of 29 April 2026, Capital.com client positioning in AMD CFDs shows 82.4% long versus 17.6% short, putting buyers ahead by 64.8 percentage points and placing sentiment firmly in long-heavy territory. This snapshot reflects open positions on Capital.com and can change rapidly as market conditions evolve.
Summary – AMD 2026
- AMD is trading at $324.78 as of 10:07am UTC on 29 April 2026, having surged from a two-year low near $76 in April 2025 to a recent high of $354.95 on 27 April 2026.
- Key price drivers include accelerating hyperscaler AI infrastructure demand, AMD's expanding GPU and CPU data-centre market share, and ongoing US export licensing restrictions on MI-series chips into China.
- AMD announced its ‘Advancing AI 2026’ flagship event for July 2026 and a 6-gigawatt GPU partnership expansion with Meta, while Intel's stronger-than-expected Q1 CPU results lifted sentiment across the broader CPU market, including AMD.
- Q1 2026 earnings are due on 5 May 2026, with analyst consensus expectations of $1.27 EPS and $9.84 billion in revenue. The prior quarter beat consensus with $1.53 EPS and $10.27 billion in revenue.
Past performance is not a reliable indicator of future results.
FAQ
Who owns the most AMD stock?
What is the five-year Advanced Micro Devices share price forecast?
Is Advanced Micro Devices a good stock to buy?
Could AMD stock go up or down?
Should I invest in Advanced Micro Devices stock?
Can I trade AMD CFDs on Capital.com?
Yes, you can trade AMD CFDs on Capital.com. Trading share CFDs lets you speculate on price movements without owning the underlying asset and to take long or short positions. However, contracts for difference (CFDs) are traded on margin, and leverage amplifies both profits and losses. You should ensure you understand how CFD trading works, assess your risk tolerance, and recognise that losses can occur quickly.