Alphabet stock forecast: Q4 results, higher AI capex
Alphabet is the parent company of Google, with Q4 2025 results beating forecasts, while its elevated 2026 capex plan and ongoing antitrust case continue to shape the stock’s outlook. Past performance is not a reliable indicator of future results. Explore third-party GOOG price targets & technicals.
Alphabet Inc (GOOG) is trading at $309.69 as of 11:58am UTC on 18 March 2026, within an intraday range of $301.95–$311.26 on Capital.com’s quote feed. Past performance is not a reliable indicator of future results.
Sentiment has been shaped by several concurrent factors. Alphabet reported Q4 2025 adjusted EPS of $2.82 on revenue of $113.83 billion, both ahead of Wall Street consensus (CNBC, 4 February 2026), while its $175–$185 billion capex guidance for 2026 – well above the roughly $120 billion analysts had anticipated – has kept investor focus on AI spending returns (Reuters, 4 February 2026).
Separately, the US Department of Justice and a group of states filed appeals in early February 2026 against the September 2025 remedies ruling in Google’s search antitrust case, keeping regulatory risk in the background (Reuters, 3 February 2026). Broader tech sentiment also received a lift on 16–17 March 2026 after the Nasdaq Composite rebounded to close at 22,374.18, recovering from recent 2026 lows as risk appetite returned to large-cap technology names. Past performance is not a reliable indicator of future results (Yahoo Finance, 17 March 2026).
Alphabet stock forecast 2026–2030: Third-party price targets
As of 18 March 2026, third-party Alphabet stock predictions reflect a broadly constructive Wall Street view, with a Buy consensus across major aggregators and individual 12-month targets spanning $300–$420. The following mini-briefs summarise the most recent citable third-party estimates from that window.
MarketBeat (consensus update)
MarketBeat reports that the consensus Buy rating across 41 contributing analysts carries an updated average 12-month target of $345.71, with 9 Strong Buy and 29 Buy ratings. The firm notes that Alphabet shares traded near $309 during the session, with a market capitalisation of approximately $3.74 trillion, while the consensus target implies roughly 11.7% upside from that intraday level (MarketBeat, 17 March 2026).
MarketScreener (Wall Street consensus)
MarketScreener compiles a Buy mean consensus from 66 analysts, with an average 12-month target of $376.95 and a high estimate of $443. The spread reflects diverging views on the pace of AI revenue conversion and the scale of capital expenditure pressure on margins, with the antitrust appeal backdrop cited as an ongoing overhang (MarketScreener, 16 March 2026).
Baird (broker action)
Robert W. Baird raises its 12-month price target on Alphabet to $380, up from $375, while maintaining an outperform rating. The adjustment follows a reassessment of Alphabet’s AI-driven product pipeline and cloud scaling trajectory, as the firm notes that the revised target joins multiple recent broker upgrades that leave the MarketBeat consensus near $367 (MarketBeat, 6 March 2026).
Public.com (aggregated consensus)
Public.com reports an aggregated consensus price target of $322 for GOOG, with a Buy skew across contributing analysts, noting 50% at Strong Buy and 40% at Buy. The platform draws on 10 analysts in its aggregation and presents the figure as a 12-month forward estimate, without disaggregating individual broker targets (Public.com, 16 March 2026).
Predictions and third-party forecasts are inherently uncertain, as they cannot fully account for unexpected market developments. Past performance is not a reliable indicator of future results.
GOOG stock price: Technical overview
The GOOG stock price trades at $309.69 as of 11:58am UTC on 18 March 2026, sitting above the short-term moving average shelf but just below the mid-range cluster, reflecting a tug-of-war between near-term buyers and a heavier overhead band.
On the moving average picture, the 20/50/100/200-day SMAs sit at approximately $306 / $319 / $309 / $258, producing a split structure: price holds above the 100-day SMA near $308.76 and well above the 200-day SMA at $258.47, yet trades beneath the 50-day SMA at $318.91 and the 30-day SMA at $311. The 10- and 20-day SMAs at $304 and $306 are showing buy signals and sit below the current price, suggesting short-term momentum has turned constructive. However, the absence of a clean 20-over-50 alignment in the same family means the medium-term picture remains mixed. The Ichimoku base line at $310.84 sits fractionally above the latest price and acts as a nearby ceiling to watch.
Momentum is broadly neutral with a mild positive lean: the 14-day RSI is at 49.80, close to the midpoint and not extended in either direction, while the ADX(14) at 27.68 indicates that an established directional trend is in place rather than sideways drift.
On the topside, the classic R1 at $342.09 is the first meaningful pivot resistance. A convincing daily close through that level would put R2 at $372.74 in view as the next reference. The round $320 area – near the classic pivot point at $319.49 – represents an immediate hurdle, and price would need to build acceptance above it before the R1 zone comes into play.
On pullbacks, initial support rests at the 100-day SMA near $308.76, while the classic pivot point at $319.49 remains a nearby reference level. Losing the 100-day SMA shelf would risk a deeper pull towards S1 at $288.84, which marks the next meaningful classic support reference below (TradingView, 18 March 2026).
This is technical analysis for informational purposes only and does not constitute financial advice or a recommendation to buy or sell any instrument.
Alphabet share price history (2024–2026)
GOOG’s stock price opened March 2024 trading around $148–$152, having steadily climbed from those levels throughout the year. Shares pushed towards the $192–$193 range by mid-July 2024 before pulling back to the low $150s in late April 2025 – a trough driven by broader tech sector volatility and tariff-related uncertainty that briefly dragged GOOG to an intraday low of $140.88 on 7 April 2025.
The recovery from those April 2025 lows was swift and sustained. GOOG regained the $165 area by May 2025 and continued climbing through the summer, reaching the $180–$195 range by August–September 2025, before a strong Q4 earnings season and AI-driven sentiment pushed the stock to a peak close of $350.33 on 3 February 2026 – its highest point in the dataset.
Since that February 2026 peak, GOOG has retraced, closing at $309.69 on 18 March 2026. That represents approximately 11.6% below the early-February high, though it also marks roughly 90% appreciation from the March 2024 opening levels near $148–$152, reflecting the scale of the two-year run.
Past performance is not a reliable indicator of future results. Share prices are indicative and may differ from live market prices.
Alphabet (GOOG): Capital.com analyst view
Alphabet’s GOOG stock has broadly reflected the company’s underlying business momentum over the past year, with shares rising from the mid-$160s in early 2025 to a peak close above $350 in early February 2026, supported by Q4 2025 results that showed 18% year-on-year revenue growth and a 48% surge in Google Cloud revenue. The company’s $175–$185 billion capital expenditure plan for 2026 has reinforced confidence among those who see AI infrastructure investment as the basis for longer-term cloud and advertising growth. At the same time, it raises legitimate questions about near-term margin pressure and whether returns on that spending will materialise on the timeline the market is pricing in.
The stock has retraced from its February 2026 highs to trade near $309.69 as of 18 March 2026, a move that reflects the market’s ongoing reassessment of that capital intensity alongside persistent regulatory uncertainty, with the DOJ antitrust appeal in the search case still unresolved. Those legal proceedings represent a meaningful structural overhang, particularly given the potential for follow-on litigation, though some observers note that Alphabet’s search and advertising dominance has proved resilient through previous legal challenges. Both the growth case and the risk factors remain live and contested.
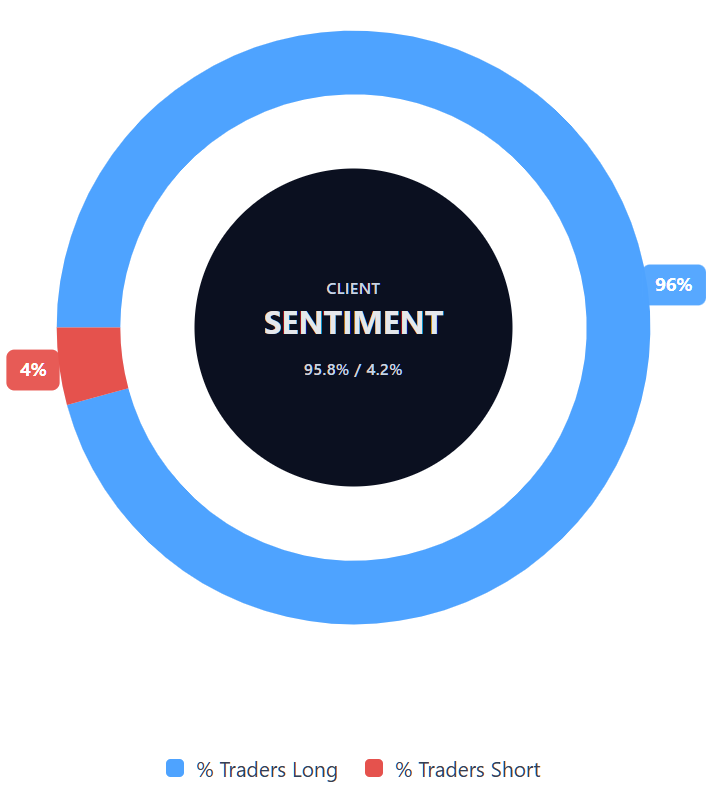
Capital.com’s client sentiment for Alphabet CFDs
As of 18 March 2026, Capital.com client positioning in Alphabet CFDs sits at 95.8% buyers and 4.2% sellers, which puts buyers ahead by 91.6 percentage points and places sentiment firmly in a heavy-buy, one-sided-towards-longs territory. This snapshot reflects open positions on Capital.com and can change.
Summary – Alphabet 2026
- As of 11:58am UTC on 18 March 2026, GOOG trades at $309.69, roughly 90% above March 2024 levels near $148–$152 but around 11.6% below the February 2026 peak close of $350.33.
- Technical indicators are mixed: short-term SMAs signal buy, while the 30- and 50-day SMAs sit above the current price, creating overhead resistance. The 14-day RSI at 49.80 reflects neutral momentum with no clear directional conviction.
- Key price drivers include Alphabet’s $175–$185 billion 2026 capex plan, Google Cloud’s 48% revenue surge in Q4 2025, and ongoing DOJ antitrust appeal proceedings in the search case.
Past performance is not a reliable indicator of future results.
FAQ
Who owns the most Alphabet stock?
What is the 5 year Alphabet share price forecast?
Is Alphabet a good stock to buy?
Could Alphabet stock go up or down?
Alphabet stock could move in either direction, depending on how company performance and broader market conditions develop. Factors that may support the share price include stronger-than-expected earnings, cloud growth, improving sentiment towards large-cap technology and evidence that AI-related spending is generating returns. Factors that may weigh on the stock include weaker margins, slower revenue growth, regulatory developments or a deterioration in wider risk appetite. Share prices react to new information, so future moves remain uncertain.
Should I invest in Alphabet stock?
Can I trade Alphabet CFDs on Capital.com?
Yes, you can trade Alphabet CFDs on Capital.com. Trading share CFDs lets you speculate on price movements without owning the underlying asset and to take long or short positions. However, contracts for difference (CFDs) are traded on margin, and leverage amplifies both profits and losses. You should ensure you understand how CFD trading works, assess your risk tolerance, and recognise that losses can occur quickly.