Airbus stock forecast: Tariff pressure, AGM focus
Airbus is a European aerospace group whose shares remain sensitive to trade policy, analyst rating changes, and shareholder decisions ahead of its 14 April 2026 AGM. Past performance is not a reliable indicator of future results. Explore third-party AIR price targets and technical analysis.
Airbus SE (AIR) is trading at €175.20 as of 3:59pm UTC on 8 April 2026, within an intraday range of €160.83 – €176. Past performance is not a reliable indicator of future results.
The partial recovery comes amid persistent uncertainty over US trade policy, as the Trump administration's broad tariff measures continue to weigh on industrial and aerospace sentiment. Airbus CEO Guillaume Faury had previously warned in January 2026 that trade pressures had already 'caused significant collateral damage, logistically and financially' (Reuters, 26 January 2026). Adding to near-term headwinds, Goldman Sachs removed Airbus from its European Conviction List on 1 April 2026 (StreetInsider, 1 April 2026), while Wells Fargo initiated coverage with an Equal Weight rating on 31 March 2026 (Futunn, 1 April 2026), reflecting cautious analyst positioning ahead of the company's Annual General Meeting scheduled for 14 April 2026 in Amsterdam, where shareholders are set to vote on a proposed 2025 gross dividend of €3.20 per share (Airbus, 3 March 2026).
Airbus stock forecast 2026–2030: Third-party price targets
As of 8 April 2026, third-party Airbus stock predictions span a wide range, with coverage from major brokerages reflecting diverging views on delivery execution, production ramp timelines, and exposure to US trade policy.
Wells Fargo (Equal Weight initiation)
Wells Fargo initiated coverage of Airbus with an Equal Weight rating and a AIR stock forecast of €175. The bank noted that despite delays in the A320 production ramp, Airbus's long-term order book remains robust, though near-term delivery execution and tariff exposure affect the near-term risk/reward balance (Futunn, 1 April 2026).
Barclays (Buy, target maintained)
Barclays analyst Milene Kerner maintained a Buy rating on Airbus, keeping the price target at €220. The bank's constructive stance is underpinned by expectations of continued delivery growth and meaningful EBIT expansion across the 2025–2027 period, with the widebody mix providing incremental margin support (MarketScreener, 24 March 2026).
Erste Group Bank (Hold, target and EPS revision)
Erste Group Bank analyst H. Engel trimmed the FY2026 EPS estimate for Airbus to $2.10 from $2.11, while retaining a Hold rating on the stock. The revision reflects cautious near-term assumptions around delivery volumes, amid quarterly revenue of $30.25bn that fell short of the $33.55bn consensus (MarketBeat, 8 April 2026).
J.P. Morgan (Buy, target maintained)
J.P. Morgan analyst David Perry reaffirmed a Buy rating on Airbus with a price target of €225. Perry's thesis centres on the structural demand backdrop for narrowbody aircraft, with the A320 family backlog providing multi-year revenue visibility as airline fleet renewal activity accelerates (The Globe and Mail, 8 April 2026).
MarketScreener (consensus overview)
MarketScreener's aggregated consensus places the average analyst price target for Airbus at €216.66, derived from 22 contributing analysts, with the consensus rating at Outperform. The range of individual estimates reflects the breadth of views, with bulls anchored on delivery ramp progress and bears citing execution risk and tariff-related cost pressure (MarketScreener, 4 March 2026).
Predictions and third-party forecasts are inherently uncertain, as they cannot fully account for unexpected market developments. Past performance is not a reliable indicator of future results.
AIR stock price: Technical overview
The AIR stock price is trading at €175.20 as of 3:59pm UTC on 8 April 2026, sitting just above the classic pivot at €166.79 and below the 50-, 100-, and 200-day simple moving averages at roughly €180, €191, and €191, which collectively form a layer of overhead resistance on the daily chart, according to TradingView data.
The short-term moving average structure is constructive: the 10-, 20-, and 30-day SMAs at €165, €167, and €171 are all generating buy signals, while the Hull moving average (9) at €168.35 and the volume-weighted moving average (20) at €166.53 align in the same direction. The longer-dated 50-day and 100-day SMAs, however, sit above the last price at €180 and €191 respectively, indicating the stock remains in a corrective phase relative to its medium-term trend.
Momentum is mixed. The 14-day relative strength index reads 54.28, placing it in the upper-neutral range, while the average directional index at 29.59 suggests that an established trend is in force. The classic R1 pivot at €176.17 is the nearest reference above the last price; a daily close above that level would put the R2 zone near €191.51 in view. On pullbacks, the classic pivot at €166.79 represents initial reference support, with the S1 level at €151.45 acting as the next downside marker if that area gives way (TradingView, 8 April 2026).
This is technical analysis for informational purposes only and does not constitute financial advice or a recommendation to buy or sell any instrument.
Airbus share price history (2024–2026)
AIR’s stock price opened April 2024 trading around €164.95, remaining broadly range-bound through the summer before slipping to a two-year low of €126.71 intraday on 7 April 2025, as a wave of global tariff-related selling hit European equities. The stock closed 2024 at €155.14, meaning it entered 2025 slightly below where it started that year.
2025 saw Airbus grind higher through the first quarter, reaching approximately €175.58 on 3 March before retreating. The sharp sell-off in early April 2025, triggered by broad market risk-off moves, pulled the stock as low as €126.71 on an intraday basis on 7 April 2025; it recovered to close that month near €147. From there, AIR staged a steady climb through the summer, reclaiming the €190s by late September and touching a high of €221.63 intraday on 14 January 2026 – its strongest level across the two-year window.
The stock pulled back materially from that January 2026 peak, closing March 2026 at €160.43 before another sharp intraday dip to €161.01 on 7 April 2026. AIR is trading at €175.24 as of 8 April 2026, which is approximately 11.7% below the 1 January 2026 open of €200.20, and around 13.0% above the 7 April 2025 close of €135.36.
Past performance is not a reliable indicator of future results. Share prices are indicative and may differ from live market prices.
Airbus (AIR): Capital.com analyst view
Airbus shares have faced a turbulent start to 2026, with AIR pulling back roughly 12% from its January peak near €221.63 to trade around €175.20 as of 8 April 2026, as broad macro headwinds and trade tariff uncertainty weighed on European industrial names. On the constructive side, Airbus retains one of the largest commercial aircraft order backlogs in the industry, providing multi-year revenue visibility; a gradual A320 production ramp could support margin recovery if supply chain constraints ease. However, execution risk remains material, with the company having missed Q4 2025 revenue consensus, and any further disruption to narrowbody delivery schedules could delay the earnings recovery several analysts are pricing in.
The external backdrop adds another layer of complexity. A softer euro and momentum in European defence spending may offer some support for sentiment around the broader aerospace sector, while US tariff policy continues to introduce cost and logistics uncertainty for manufacturers with transatlantic supply chains. Airbus CEO Guillaume Faury flagged ‘significant’ trade-related damage as recently as January 2026, and any escalation could weigh further on near-term guidance.
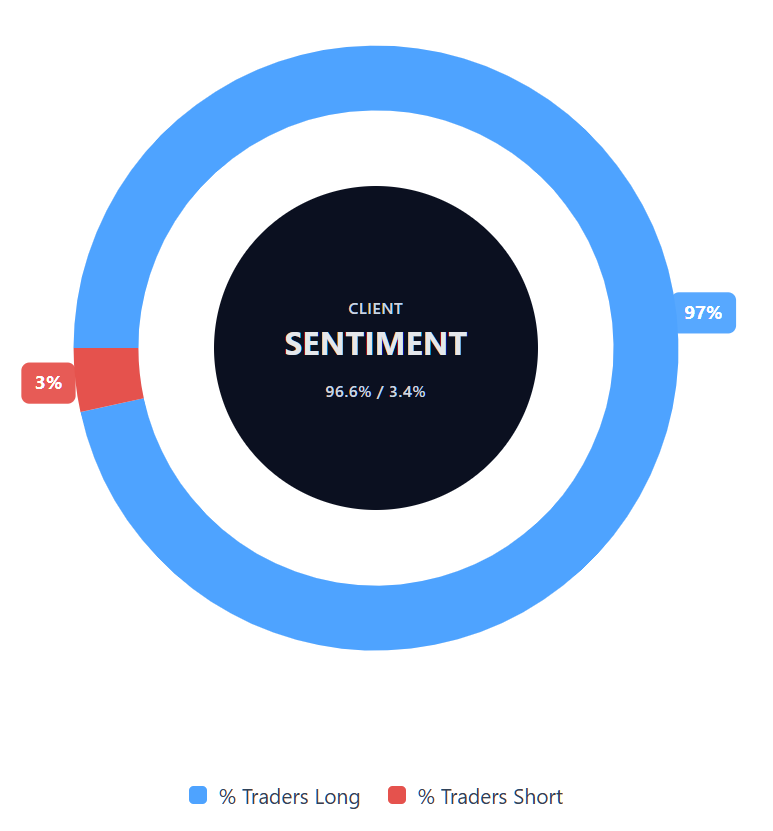
Capital.com’s client sentiment for Airbus CFDs
As of 8 April 2026, Capital.com client positioning in Airbus CFDs shows 96.6% buyers and 3.4% sellers, which places it firmly in heavy-buy territory with buyers ahead by 93.2 percentage points. This snapshot reflects open positions on Capital.com and can change.
Summary – Airbus 2026
- As of 3:59pm UTC on 8 April 2026, Airbus (AIR) is trading at €175.20, around 12% below its January 2026 intraday high of €221.63.
- Key price drivers include ongoing US tariff uncertainty, Airbus's A320 production ramp execution risk, and a mixed Q4 2025 earnings result that missed revenue consensus.
- Recent newsflow centres on Goldman Sachs removing Airbus from its European Conviction List on 1 April 2026 and Erste Group Bank lowering its FY2026 EPS estimate on 8 April 2026.
- On TradingView, short-term moving averages (10-, 20-, and 30-day SMAs) are generating buy signals, while the 50-, 100-, and 200-day SMAs sit above the current price, indicating the stock remains in a medium-term corrective phase.
Past performance is not a reliable indicator of future results.
FAQ
Who owns the most Airbus stock?
What is the 5 year Airbus share price forecast?
Is Airbus a good stock to buy?
Could Airbus stock go up or down?
Should I invest in Airbus stock?
Can I trade Airbus CFDs on Capital.com?
Yes, you can trade Airbus CFDs on Capital.com. Trading share CFDs lets you speculate on price movements without owning the underlying asset and to take long or short positions. However, contracts for difference (CFDs) are traded on margin, and leverage amplifies both profits and losses. You should ensure you understand how CFD trading works, assess your risk tolerance, and recognise that losses can occur quickly.