Solaria Energía y Medio Ambiente stock forecast: Third-party price targets
Solaria is a Spain-based renewable energy company listed in Madrid, operating solar generation assets and related infrastructure, with its share price reflecting company performance and broader energy market conditions. Explore third-party SLR price targets and technical analysis.
Solaria Energía y Medio Ambiente, S.A. (SLR) – or Solaria – is trading around €18.01 on Capital.com’s platform as of 11:25am (UTC) on 28 January 2026, moving within an intraday range from a low of €17.80 to a high of €18.50. Past performance is not a reliable indicator of future results.
The stock is trading against a backdrop of relatively firm Spanish equity conditions, with Spain’s IBEX 35 benchmark fluctuating in the 17,671.70–17,830.30 area as corporate earnings and geopolitical headlines shape broader risk sentiment (MarketScreener, 28 January 2026). Company-specific attention remains on Solaria’s strategy in solar generation and related infrastructure, including expansion into data centres and battery storage (Bloomberg, 15 November 2025), as well as its reporting of higher revenue, EBITDA and net profit through 2025 (Solaria, 11 November 2026).
Solaria stock forecast 2026–2030: Third-party price targets
As of 28 January 2026, third-party Solaria stock predictions cluster around mid- to high-teens euro levels, with dispersion reflecting differing views on Spanish power prices, regulation and the company’s growth pipeline. Across brokers and data platforms, targets are typically framed as 12-month fair-value estimates for Solaria’s Madrid-listed shares rather than as specific year-end marks.
MarketScreener (broker consensus)
MarketScreener says its Solaria consensus, based on around 16 covering analysts, points to an average 12-month target of around €17.44, with individual targets ranging between €9 and €18.53. The service notes that this spread reflects differing assumptions on Spanish renewables policy and Solaria’s execution across its project pipeline amid sector-wide volatility (MarketScreener, 28 January 2026).
Investing.com (SLR consensus update)
Investing.com‘s SLR stock forecast page referenced an average 12-month analyst target of around €17.44, with a high estimate of €25.40 and a low estimate of €9. It reports that this spread sits alongside a ‘Buy’-tilted recommendation balance, amid expectations for earnings growth combined with uncertainty around power prices and regulatory outcomes (Investing.com, 28 January 2026).
Simply Wall St (valuation narrative)
Simply Wall St states that its narrative fair-value estimate for Solaria stands around €17.44 per share versus a contemporaneous market price near €18. It cites assumptions around earnings growth from new energy infrastructure, set against considerations such as financing needs and exposure to government taxes and power-price swings (Simply Wall St, 27 January 2026).
Predictions and third-party forecasts are inherently uncertain, as they cannot fully account for unexpected market developments. Past performance is not a reliable indicator of future results.
SLR stock price: Technical overview
The SLR stock price is trading near €18.01 as of 11:25am (UTC) on 28 January 2026, holding above a rising daily moving-average cluster, with the 20-, 50-, 100- and 200-day SMAs around 17.9, 17.4, 15.5 and 12.5 respectively, and a 20-over-50 alignment in place. The 14-day RSI sits near 53.2, in mid-neutral territory, while the ADX, at around 15.0, points to a relatively weak trend backdrop despite price hovering above the moving-average band.
On the topside, the nearest classic resistance sits at R1 around 18.9, with R2 near 19.7 coming into view only if a sustained daily close develops above that first pivot area. On pullbacks, the classic pivot at 17.5 marks initial support, with the 100-day SMA near 15.5 forming the next notable moving-average shelf and S1 around 16.8 acting as a further downside reference if that zone gives way (TradingView, 28 January 2026).
This technical analysis is provided for informational purposes only and does not constitute financial advice or a recommendation to buy or sell any instrument.
Solaria share price history (2024–2026)
SLR’s stock price has climbed sharply over the past two years, shifting from a mid-teens range in early 2024 to the high-teens by late January 2026. The stock closed at about €13.70 on 31 January 2024, dipped below €10 at several points through April as broader markets wobbled, then spent much of mid-2024 consolidating around €11–€12.50 as sentiment towards renewables steadied.
Momentum accelerated in 2025, with Solaria edging higher through the summer from roughly €10–€11 in July before a strong rally from late September saw the price rise from around €11.77 on 1 October to above €18 by year-end. That move extended into early 2026, with the stock closing at €18.10 on 28 January 2026, meaning it has roughly doubled from its late-June 2025 closing level near €9.88 and gained materially from the low-€11s area seen in September 2024.
Past performance is not a reliable indicator of future results. Share prices are indicative and may differ from live market prices.
Solaria (SLR): Capital.com analyst view
Solaria’s share price has staged a strong recovery into early 2026, moving from low double-digit levels in mid-2024 to the high-teens more recently as sentiment towards solar and broader renewables has improved. Company updates highlighting robust 2025 operating and financial metrics, including sharp year-on-year rises in revenue, EBITDA and net profit, have helped underpin this move, even as periods of volatility in European power prices and bond yields have occasionally weighed on the sector. At the same time, the stock’s sensitivity to changes in policy signals, interest-rate expectations and equity risk appetite means pullbacks have remained a recurring feature, and sudden shifts in macro conditions or sector flows could just as easily pressure the price as support it.
From a fundamental standpoint, Solaria’s multi-year investment and capacity expansion plans, including hybrid storage and data-centre initiatives, are seen by many observers as potential long-term growth drivers, particularly if European electricity demand and flexibility solutions evolve as industry groups expect. However, these same projects require substantial capital and carry execution, regulatory and power-price risks, meaning disappointments around funding costs, project delivery or market pricing could have the opposite effect on valuations. This reinforces the importance of weighing both upside scenarios and downside uncertainties when assessing the stock.
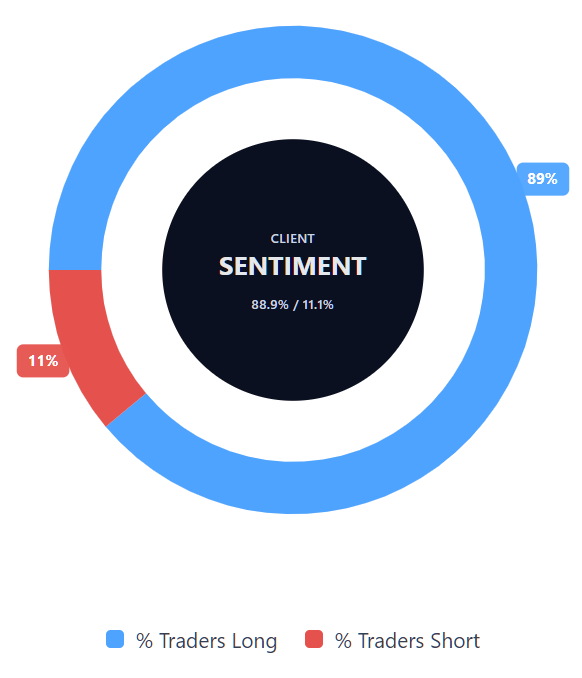
Capital.com’s client sentiment for Solaria CFDs
As of 28 January 2026, Capital.com client positioning in Solaria CFDs shows 88.9% buyers versus 11.1% sellers, a heavy-buy profile that is one-sided towards longs and puts buyers ahead by about 77.8 percentage points. This snapshot reflects open positions on Capital.com and can change.
Summary – Solaria 2026
- Solaria’s share price rose from around €9.88 in late June 2025 to about €18.31 by 31 December 2025, roughly doubling over six months.
- The stock continued to trade in the high-teens into January 2026, with intraday moves between roughly €17.80 and €18.70 in recent sessions.
- Daily technicals show SLR holding above rising 20-, 50-, 100- and 200-day moving averages, with RSI near mid-neutral levels and ADX signalling a relatively weak trend phase.
- Key drivers cited by third parties include Solaria’s expansion in solar, storage and data-centre assets, alongside evolving European power prices, policy signals and funding conditions.
Past performance is not a reliable indicator of future results.
FAQ
Who owns the most Solaria stock?
Solaria’s shareholder base includes a mix of founders, senior management and institutional investors, alongside a free float held by retail and other market participants. Public disclosures typically show that company insiders and early backers retain notable stakes, while Spanish and international investment funds hold smaller but still meaningful positions. Exact ownership percentages can change over time due to share sales, capital raises and index rebalancing, so investors usually refer to the latest regulatory filings for the most up-to-date breakdown.
What is the five-year Solaria share price forecast?
There is no single, agreed five-year share SLR stock forecast. Most publicly available projections focus on shorter horizons, typically around 12 months, and are based on assumptions that may change over time. Longer-term outcomes are influenced by factors such as electricity prices, regulation, financing conditions and the execution of Solaria’s project pipeline. As a result, five-year scenarios tend to vary widely and are often presented as illustrative rather than predictive.
Is Solaria a good stock to buy?
Whether Solaria is considered a good stock depends on an individual’s objectives, risk tolerance and market view. Supporters often point to its exposure to renewable energy, storage and infrastructure development, while risks include regulatory changes, capital requirements and sensitivity to power prices. Market participants typically weigh these factors alongside valuation metrics and broader sector conditions. This information is provided for general market insight only and does not constitute a recommendation.
Could Solaria stock go up or down?
Like most listed shares, Solaria’s stock price can move both up and down. It may react to company earnings, project developments, policy decisions affecting renewables, and shifts in broader equity or energy markets. External factors such as interest rates, electricity prices and investor risk appetite can also influence price movements. As a result, outcomes are uncertain, and price changes can occur over both short and extended periods.
Should I invest in Solaria stock?
Deciding whether to invest in Solaria stock is a personal decision that depends on individual financial circumstances, knowledge and risk appetite. Shares can offer exposure to potential growth themes but also carry the risk of losses if expectations are not met or market conditions change. Investors often consider diversification, time horizon and independent research before making any decision. This content is not intended as investment advice.
Can I trade Solaria CFDs on Capital.com?
Yes, you can trade Solaria CFDs on Capital.com. Trading share CFDs lets you speculate on price movements without owning the underlying asset and to take long or short positions. However, contracts for difference (CFDs) are traded on margin, and leverage amplifies both profits and losses. You should ensure you understand how CFD trading works, assess your risk tolerance, and recognise that losses can occur quickly.