

Nordex stock forecast: broker upgrades and targets
Nordex is a German wind-turbine manufacturer. In September 2026, Bank of America and Citi raised their Nordex price targets following its half-year results. Explore third-party NDX1 price targets and technical analysis. Past performance is not a reliable indicator of future results.
Nordex SE (NDX1) is trading at €40.09 as of 11:04am UTC on 10 September 2026, within an intraday range of €39.12–€40.82 and near the upper end of the range. Past performance is not a reliable indicator of future results.
The stock remains above levels seen before its near-10% rise on 8 September, when shares closed at €40.42 on Xetra after Bank of America upgraded Nordex to buy from neutral and raised its price target (Ad Hoc News, 7 September 2026). Citi also lifted its rating and target, citing improved margin trends following the company's half-year results (Investing.com, 8 September 2026).
Third-party Nordex outlook: broker upgrades and margin focus
As of 10 September 2026, third-party Nordex stock predictions show a range of views following several revisions in late August and early September 2026. Recent estimates reflect differing expectations around earnings, margins and future order growth.
RBC
RBC cut its Nordex target to €36 from €38 while maintaining an underperform rating. Analyst Mark Fielding took a more cautious view of Nordex's outlook than of peers including Schneider Electric and Siemens Energy following a review of second-quarter capital-goods results (MarketScreener, 20 August 2026).
Citi
Citi raised its target to €50 from €48 and upgraded Nordex to buy from neutral. The bank expects consensus EBITDA estimates to rise by 7% for 2027 and 16% for 2028, citing anticipated operating leverage and a favourable regional sales mix (Investing.com, 8 September 2026).
Bank of America
Bank of America lifted its Nordex target to €54 from €50 and upgraded the shares to buy from neutral. Analyst Alexander Jones linked the revision to earnings expectations and the possibility of higher medium-term margin guidance (Investing.com, 8 September 2026).
MarketScreener
MarketScreener's consensus of 15 analysts puts the average target at €49.31 with an overall buy rating. Individual estimates range from €35–€60, reflecting differing views on future margins and order intake (MarketScreener, 9 September 2026).
Predictions and third-party forecasts are inherently uncertain, as they cannot fully account for unexpected market developments. Past performance is not a reliable indicator of future results.
Nordex earnings: latest results and upcoming report
Nordex SE reported its half-year 2026 results on 29 July. Second-quarter sales rose 16.3% year on year to approximately €2.2bn from €1.9bn a year earlier. EBITDA more than doubled to €223.8m, lifting the EBITDA margin to 10.3% from 5.8%, while net income increased to €111.5m from €31m (Nordex SE, 29 July 2026).
Order intake in the Projects segment grew 32.2% to 3,054 MW, while the total order book reached €18.4bn as of 30 June, up from €14.3bn a year earlier. Nordex also confirmed its full-year 2026 guidance, with management continuing to focus on execution towards its medium-term margin target.
Nordex is scheduled to publish its third-quarter 2026 statement on 30 October 2026 (Nordex IR, 10 September 2026).
Past or simulated performance is not a reliable indicator of future results. Company guidance reflects management's assumptions and may not materialise as expected.
NDX1 stock price: technical overview
As of 11:04am UTC on 10 September 2026, the NDX1 stock price trades near €40.09, above its 20- and 200-day simple moving averages near €39, close to its 50-day average around €40 and below its 100-day average near €42. The 100-day SMA near €41.92 provides a higher reference, while the close spacing of the shorter averages leaves a mixed technical picture, according to TradingView.
The 14-day relative strength index (RSI) stands at 55.16, within neutral territory, while the average directional index (ADX) at 15.40 indicates limited trend strength.
Higher technical references include R1 near €40.22, the Hull moving average (9) around €40.86 and R2 near €42.70. Below the latest price, the 200-day SMA near €39.01 and classic pivot around €38.88 provide nearby references, followed by S1 near €37.42.
A rise could bring €40.22, €40.86 and €42.70 into focus, while a move lower could shift attention towards €39.01, €38.88 and €37.42. These are technical reference points rather than predictions (TradingView, 10 September 2026).
This is technical analysis for informational purposes only and does not constitute investment advice or a recommendation to buy or sell any instrument.
Nordex share price history (2024–2026)
NDX1’s stock price closed at €14.34 on 12 September 2024, having spent much of that autumn within the €13–€15 range. The stock subsequently rose through much of 2025, although it fell to €22.15 on 27 October before recovering to around €30.30 by early January 2026.
Shares moved lower to €31.72 on 12 February 2026 before recovering, reaching €48.27 on 6 May and an intraday high of €48.77 on 22 June. A summer pullback followed, with the price easing to €37.18 by early September before a near-10% rise on 8 September took NDX1 back above €40 following broker upgrades.
Nordex (NDX1) traded at €40.09 as of 11:04am UTC on 10 September 2026, up roughly 32% year to date and around 87% year on year, though still below its 2026 peak of €48.77.

Past performance is not a reliable indicator of future results. Share prices are indicative and may differ from live market prices.
Nordex (NDX1): Capital.com analyst view
Nordex shares rose from around €21 in September 2025 to above €40 by September 2026, alongside wider EBITDA margins, higher order intake and a series of broker rating changes.
Stronger order intake, margin improvement or project execution could support the shares, while slower order conversion, execution difficulties, policy changes or less favourable energy-market conditions could weigh on them. A larger order book may improve revenue visibility, but it does not guarantee that orders will convert into revenue or profit as expected.
Capital.com’s client sentiment for Nordex CFDs
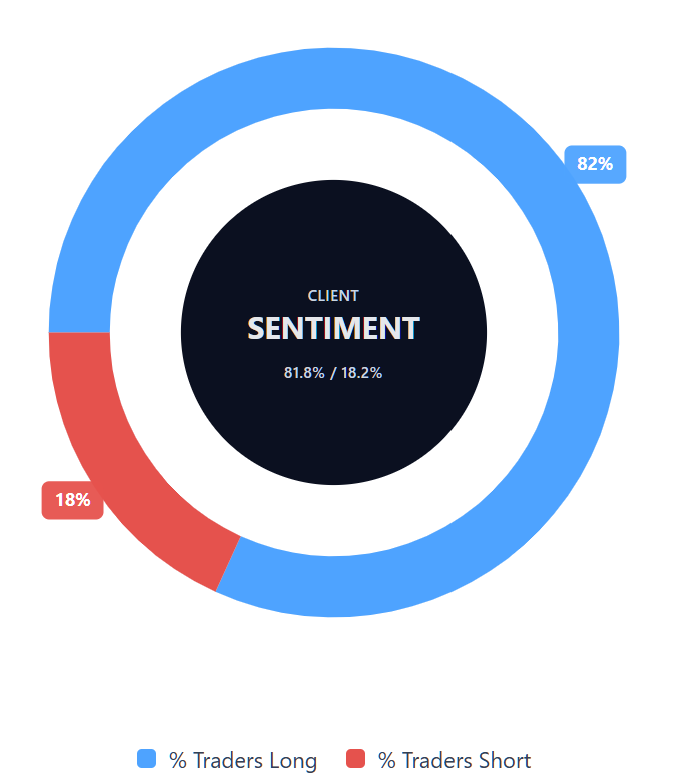
As of 10 September 2026, Capital.com client positioning in Nordex CFDs is weighted towards long positions, with 81.8% long and 18.2% short. This reflects open positions on Capital.com at the time of measurement rather than future price direction and can change.
Summary – Nordex 2026
- As of 11:04am UTC on 10 September 2026, Nordex traded near €40.09, within an intraday range of €39.12–€40.82.
- According to TradingView data, RSI stood at 55.16 within neutral territory, while ADX at 15.40 indicated limited trend strength.
- Key factors include broker rating changes, wider half-year EBITDA margins and rising order intake.
- Stronger orders, margins or execution could support sentiment, while weaker order conversion, policy changes or execution risks could weigh on the shares.
- Recent attention centres on the near-10% share-price rise on 8 September following analyst upgrades, alongside RBC's lower target and underperform rating.
Past performance is not a reliable indicator of future results.
FAQ
Who owns the most Nordex stock?
This article does not identify Nordex's largest shareholder or provide a full ownership breakdown. It focuses instead on share-price performance, earnings, order intake, analyst targets and technical indicators. Shareholdings can change as institutional and other investors adjust their positions, so current company filings or shareholder disclosures would need to be checked separately to determine which investor currently holds the largest stake in Nordex.
What is the five-year Nordex share price forecast?
The article does not provide a five-year NDX1 stock forecast. The third-party estimates covered here focus on shorter horizons, with the broader analyst range spanning €35–€60 and a consensus average of €49.31. Longer-term forecasts carry greater uncertainty because order growth, margins, policy conditions, project execution and energy-market demand can change over several years. These estimates should therefore be treated as projections rather than reliable long-term predictions.
Is Nordex a good stock to buy?
This article does not classify Nordex as a good or bad stock to buy. Stronger order intake, wider margins or improved project execution could support sentiment, while weaker order conversion, execution difficulties, policy changes or less favourable energy-market conditions could weigh on the shares. Broker views also differ, with some analysts raising targets while RBC remains more cautious. These factors provide context but do not amount to an investment recommendation.
Could Nordex stock go up or down?
Yes. Nordex shares can move in either direction as company-specific and wider market conditions change. Higher orders, margin improvement, stronger execution or supportive policy conditions could help the price. Conversely, slower order conversion, project delays, weaker demand or adverse policy changes could weigh on it. Technical levels may also influence short-term trading activity, but they are reference points rather than reliable predictions of future price movements.
Should I invest in Nordex stock?
Whether Nordex shares are suitable for you depends on your circumstances, objectives and tolerance for risk, and this article does not provide investment advice or a personal recommendation. Factors to consider include order intake, margins, project execution, policy conditions, energy-market demand and differing broker views. Each could influence the share price positively or negatively, while unexpected company, sector or market developments may change the outlook.
Can I trade Nordex CFDs on Capital.com?
Yes, you can trade Nordex CFDs on Capital.com. Trading share CFDs lets you speculate on price movements without owning the underlying asset and to take long or short positions. However, contracts for difference (CFDs) are traded on margin, and leverage amplifies both profits and losses. You should ensure you understand how CFD trading works, assess your risk tolerance, and recognise that losses can occur quickly.