

Michael Kramer: What Can Options Positioning Tell Us About Post-Earnings Moves? Nvidia as an Example
Options positioning and implied volatility are data points that analysts observe ahead of earnings events.
Author: Michael Kramer, Mott Capital Management | For publication on Capital.com
Historically, there have been instances where companies delivered solid results and shares declined and instances where weaker results were followed by share price gains. These outcomes have varied across different companies and earnings cycles, and past patterns are not indicative of future results.
NVIDIA (NVDA) is used here as an example to illustrate how options market data can be described and contextualised ahead of an earnings event. The data below reflects observable market information as of mid-May 2026. Options positioning can reflect a range of market views and does not, on its own, indicate the likely direction of the post-earnings move.
Rising Implied Volatility
Implied volatility is a measure derived from options pricing that reflects the range of price movement the market is pricing in over a given period. It does not indicate the direction of that movement, only its potential magnitude. When implied volatility rises, the options market is pricing in a wider range of possible outcomes; when it falls, that range narrows.
It has been observed that implied volatility in individual stocks tends to rise ahead of earnings events and decline once results are published; a pattern sometimes called 'volatility crush'. This is a historical observation across various securities; individual stocks may not follow this pattern. Past performance is not a reliable indicator of future results.
One way to observe implied volatility levels is through the expected move, derived from near-term options pricing. CBOE options chain data for mid-May 2026 showed NVDA pricing in an expected move of approximately 6.9% in either direction. This figure describes the range the options market was pricing; it does not represent a forecast of the actual post-earnings move.
Historically, rising implied volatility has at times been observed alongside declining share prices, though the relationship between IV and subsequent price direction is not consistent. Before NVDA's 20 May report, CBOE data showed both implied volatility and the share price rising in the weeks prior. Analysts have attributed this pattern to various factors, including call accumulation, hedging of existing long positions, and general pre-earnings uncertainty. Open interest data alone does not determine post-earnings price direction.
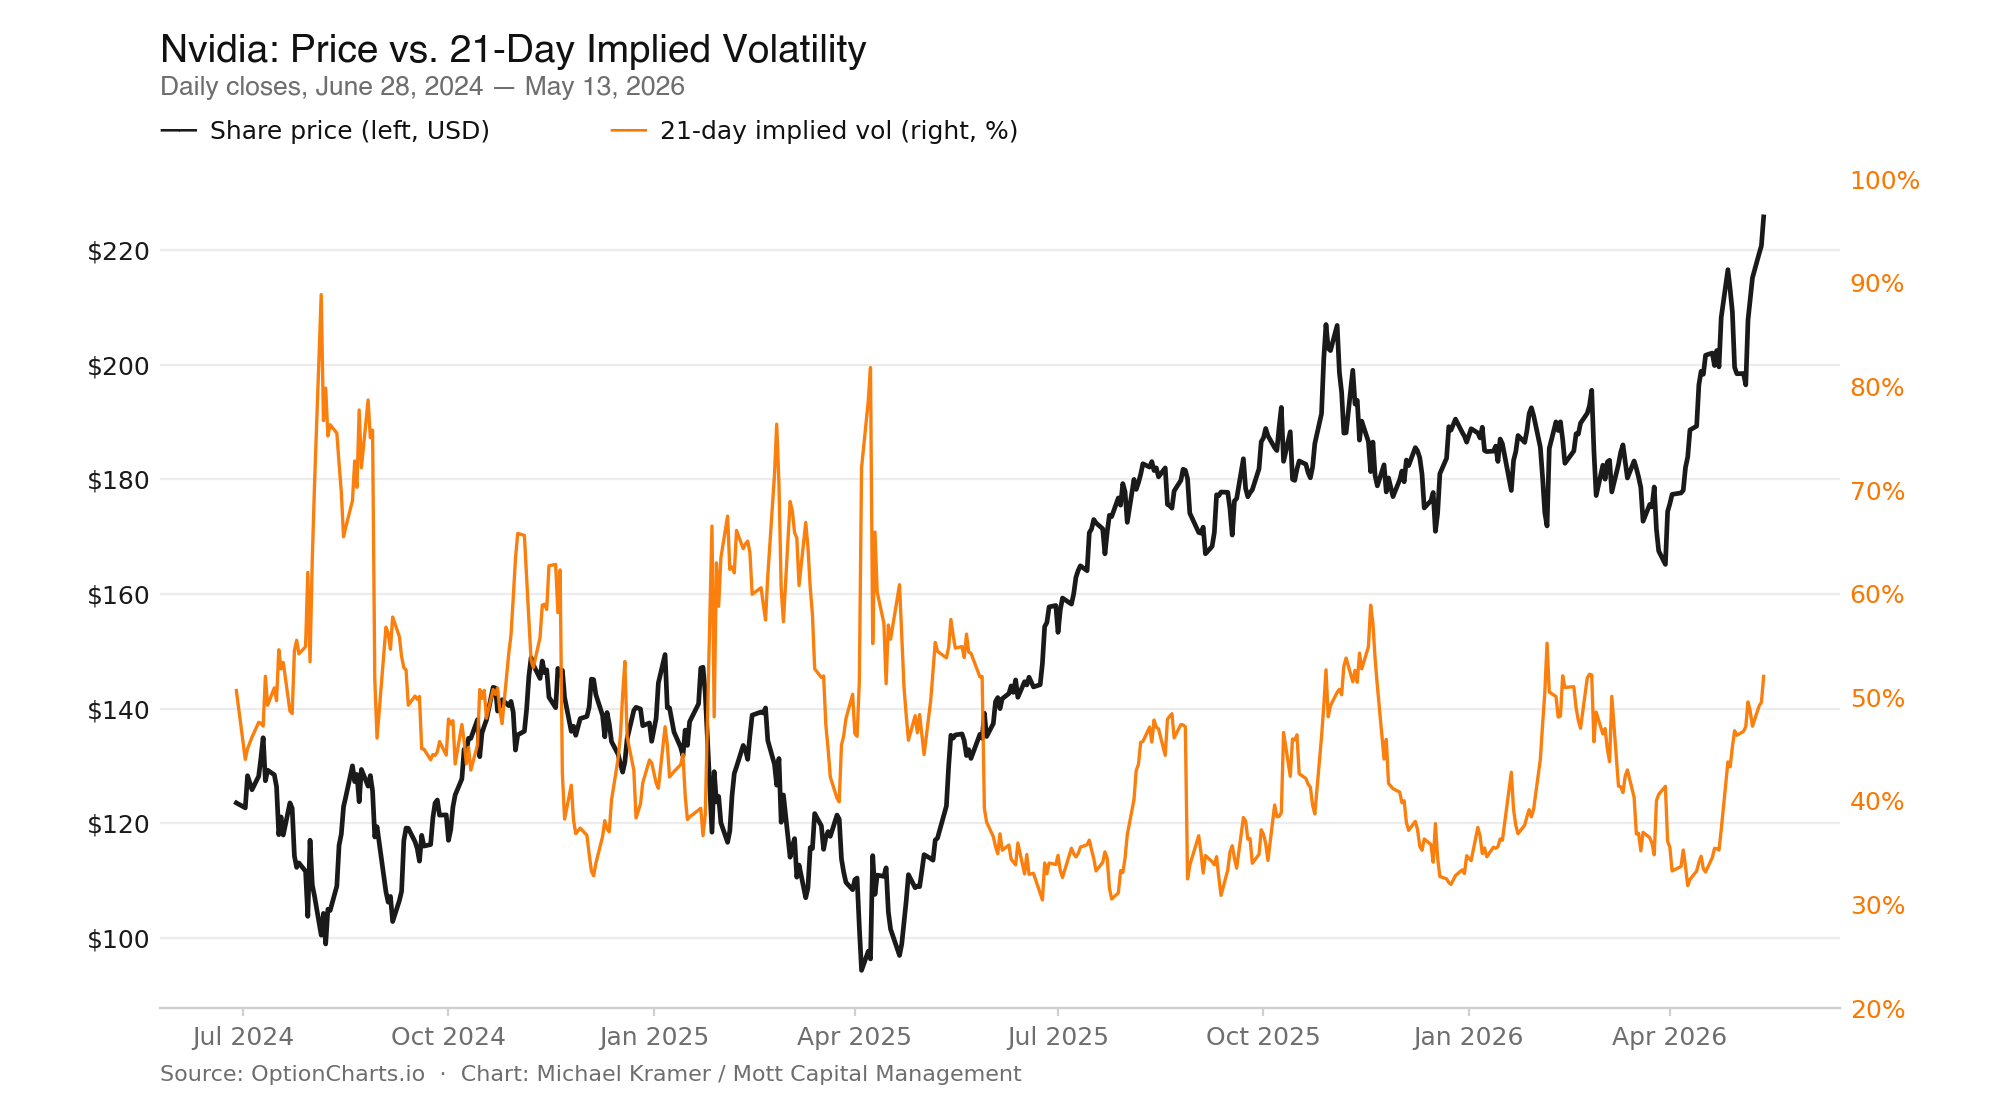
(Source: OptionCharts.io Chart: Michael Kramer / Mott Capital Management)
(Past performance is not a reliable indicator of future results)
Puts vs. Calls
The ratio of open call positions to open put positions for the nearest expiration after an earnings date is another observable data point. NVDA reported earnings on 20 May; the nearest expiration was 22 May. CBOE options chain data (mid-May 2026) showed open call interest at approximately double the number of open puts for that expiration. Elevated call open interest relative to puts can reflect a range of activity, including directional bets, hedging of short positions, or structured strategies and does not on its own indicate the expected post-earnings direction.
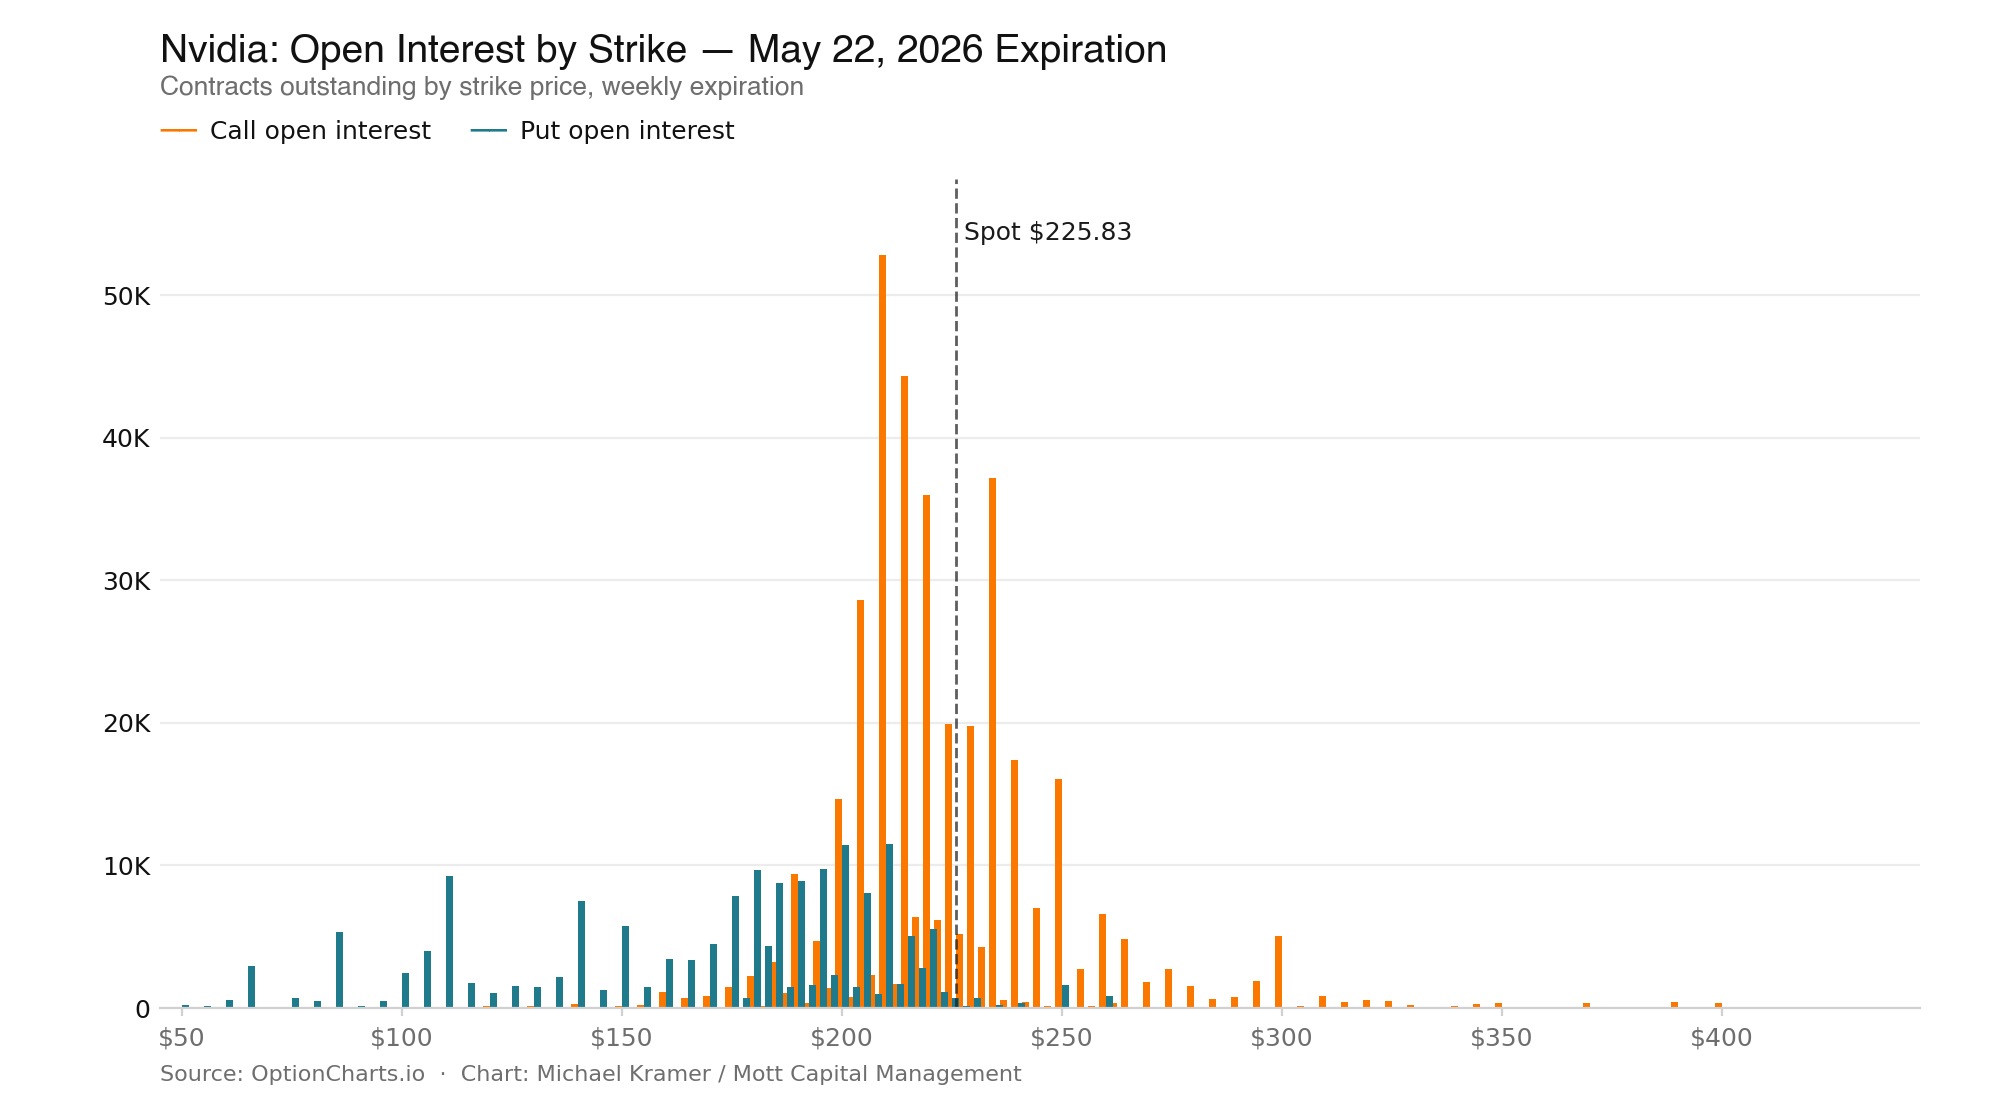
(Source: OptionCharts.io Chart: Michael Kramer / Mott Capital Management)
(Past performance is not a reliable indicator of future results)
Call-heavy open interest does not imply a directional outcome. In options markets, market makers typically sit on the opposite side of customer trades and adjust their hedges dynamically. The nature and direction of any price effect from hedge adjustments depends on a range of variables and cannot be determined from positioning data alone.
The Post-Earnings Reset
Once the earnings results were published, implied volatility on near-dated options contracts could decline. This can affect both call and put premiums, as implied volatility is a component of options pricing. The extent and speed of any such decline varies across different stocks and earnings events and is not predictable in advance.
When implied volatility declines post-earnings and market makers adjust or unwind hedges, price movements in the underlying stock may occur. These movements can be in either direction and are not necessarily aligned with the earnings result. This dynamic, sometimes described as a 'gamma unwind' has been observed in various stocks following earnings events, though outcomes have differed significantly across different securities and reporting periods.
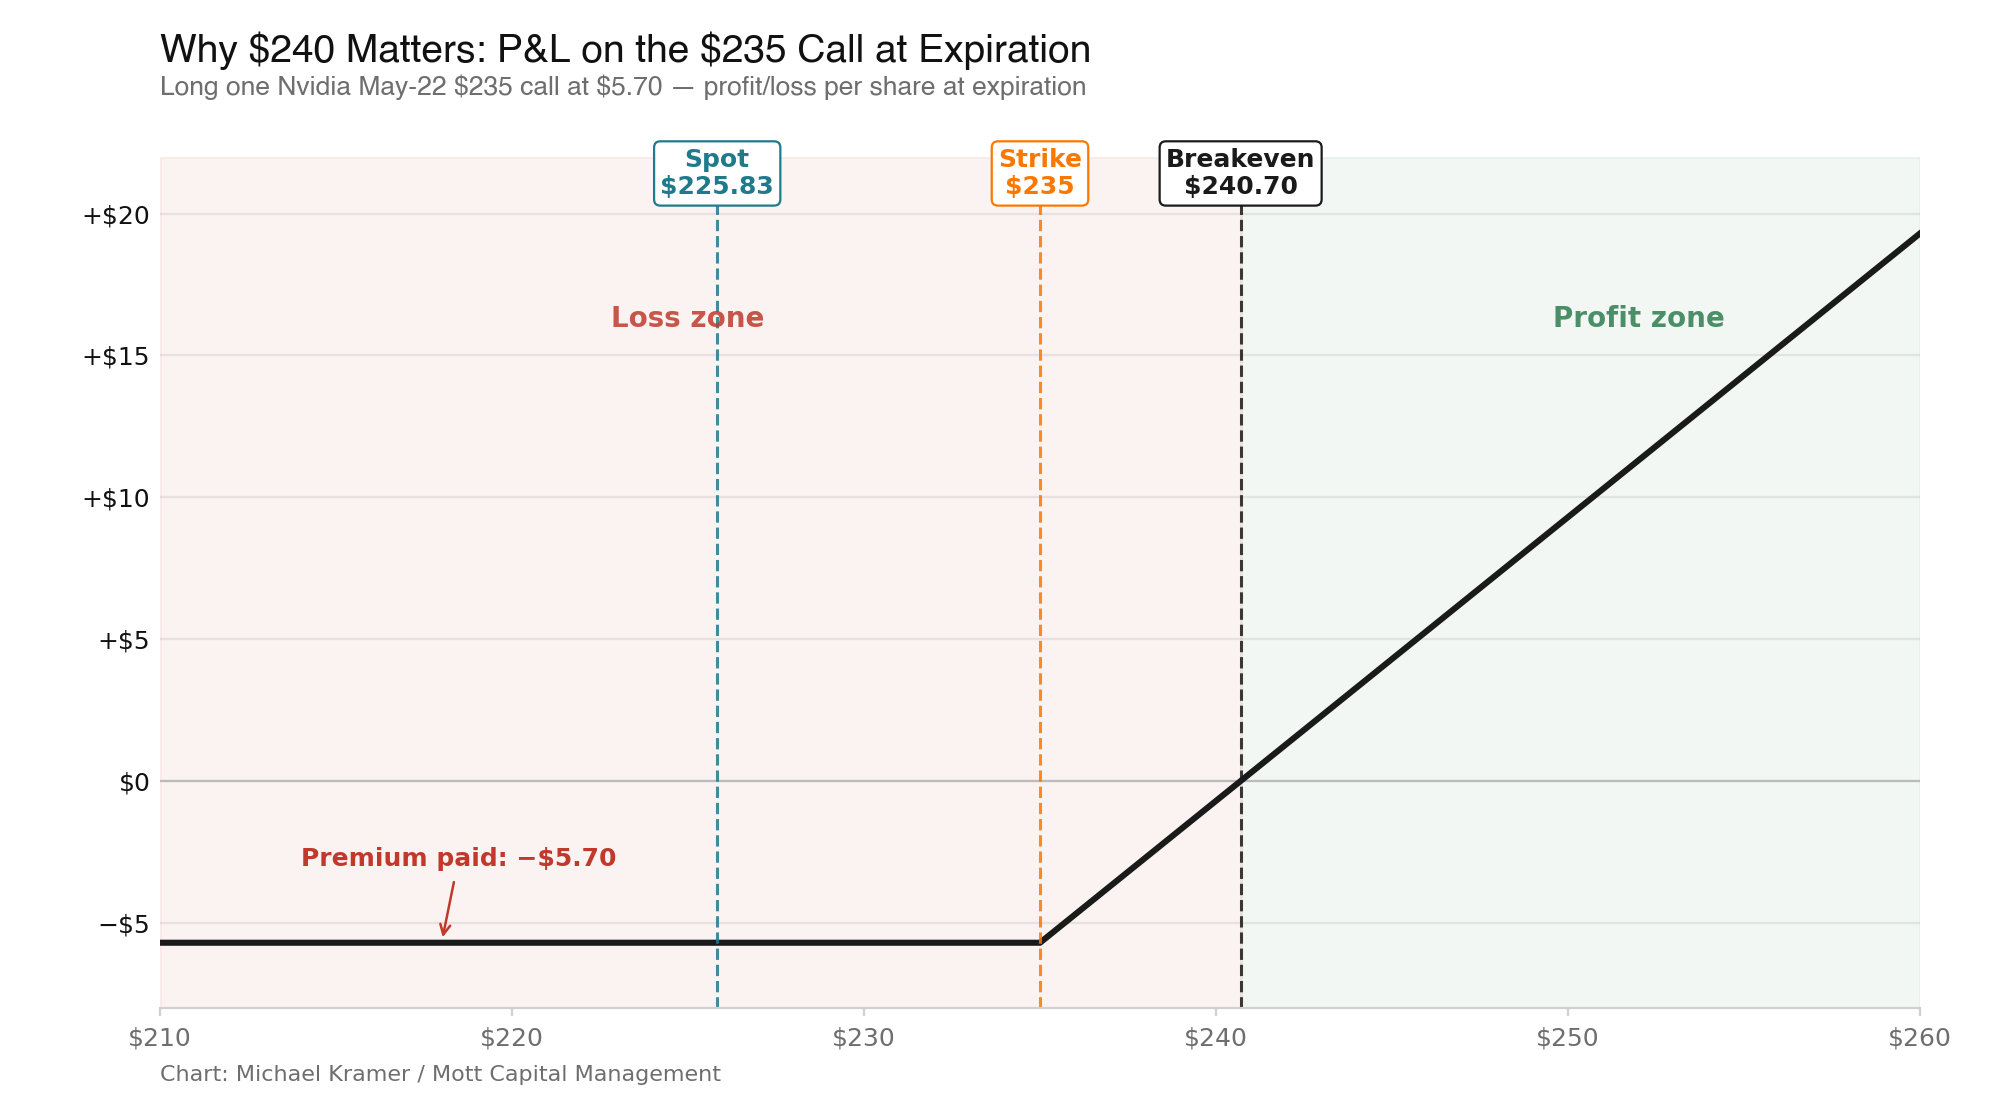
(Source:Chart: Michael Kramer / Mott Capital Management)
(Past performance is not a reliable indicator of future results)
Elevated implied volatility and skewed open interest are observable characteristics of an options market ahead of an earnings event. They describe the state of positioning at a point in time. The relationship between pre-earnings positioning and actual post-earnings price moves is not consistent, and positioning data should not be interpreted as an indication of likely future price direction.
Data references
Options data (implied volatility, expected move, open interest ratios): CBOE options chain, mid-May 2026, 22 May 2026 expiration. All charts included with this article should carry source attribution, instrument name, and date range before publication.
This material is a marketing communication and has not been prepared in accordance with legal requirements designed to promote the independence of investment research. It does not constitute investment research or investment advice and should not be treated as such.
This article is written by Michael Kramer of Mott Capital Management and is published on Capital.com for educational and informational purposes only. The views expressed are those of the author and do not represent the views of Capital.com. The content does not constitute a recommendation or solicitation to buy or sell any financial instrument. Past performance is not a reliable indicator of future results. CFDs are complex instruments and come with a high risk of losing money rapidly due to leverage. The majority of retail investor accounts lose money when trading CFDs. You should consider whether you understand how CFDs work and whether you can afford to take the high risk of losing your money.