What is a bullish harami pattern?
Learn how to identify and trade the bullish harami pattern – a two-candlestick formation that indicates a potential shift from bearish to bullish momentum.
Bullish harami pattern meaning
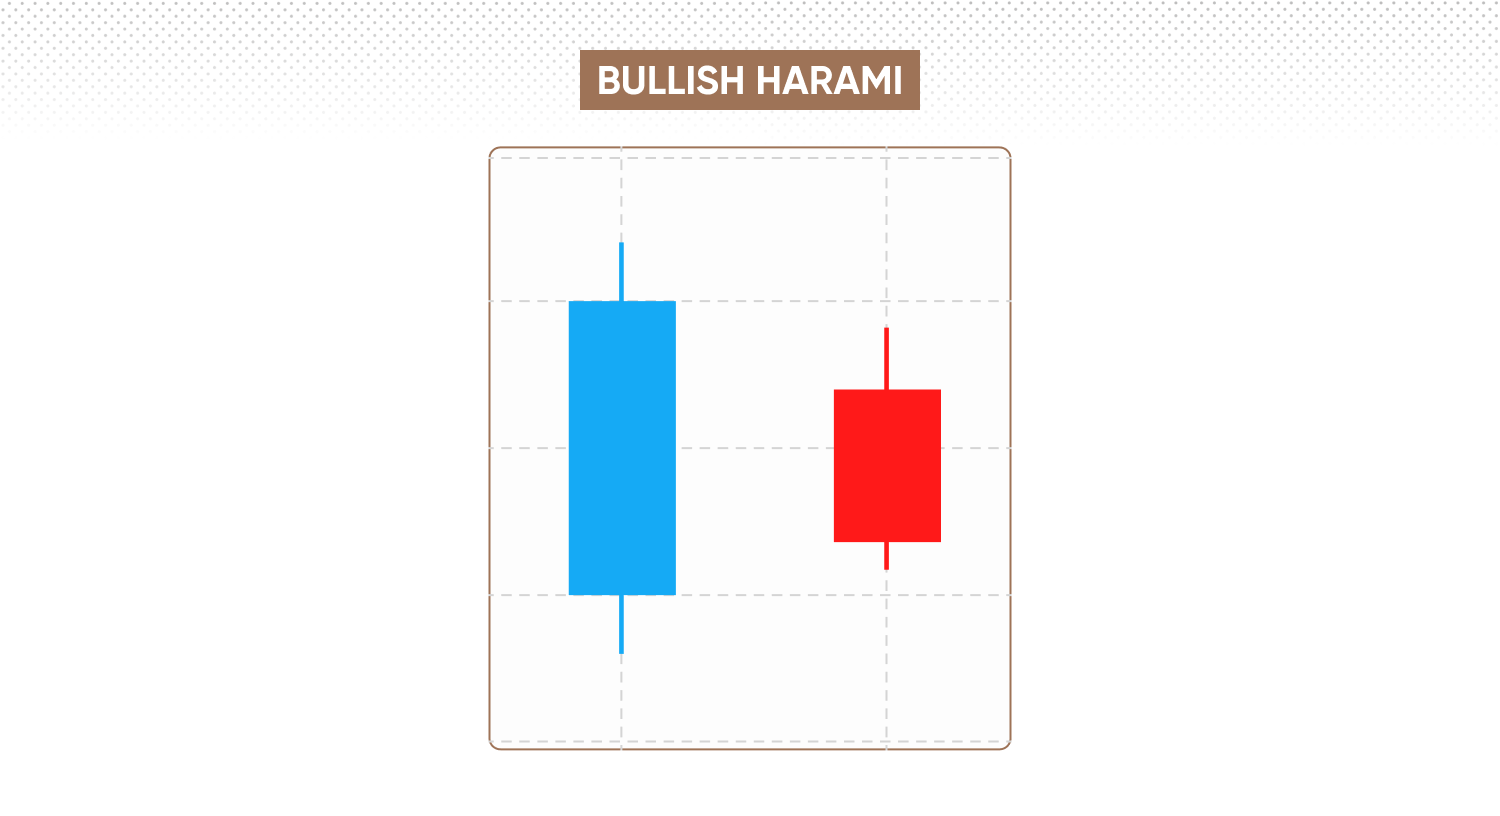
A bullish harami is a two-candlestick chart pattern that may signal a potential reversal from a downtrend to an uptrend.
The name ‘harami’, meaning pregnant in Japanese, reflects the visual layout: a large bearish candle followed by a smaller bullish candle nestled entirely within the first. The smaller candle represents weakening selling pressure and the early signs of buyer interest.
This formation suggests bearish momentum is fading. While the initial bullish move may be subtle, the pattern indicates a possible shift in market sentiment as buyers begin to regain control.
What does a bullish harami indicate in trading?
In trading, the bullish harami pattern can precede a shift in price direction, indicating that downward momentum may be fading. The initial large bearish candle reflects persistent selling pressure, whereas the subsequent smaller bullish candle, contained entirely within the prior body, signals hesitation among sellers and the emergence of buying interest.
This two-candle formation can appear after a sustained downtrend, acting as an early signal that bearish control might be weakening. However, the bullish harami is rarely a standalone signal. Its reliability improves when supported by additional confirmation – such as rising volume, a clear change in short-term trend direction, or support from technical indicators.
A bullish harami forming within an established downtrend, particularly at a support level or alongside increased buying interest, is generally regarded as more significant. Conversely, in a ranging or sideways market, its implications are typically less robust.
Past performance is not a reliable indicator of future results.
How to identify a perfect bullish harami pattern
You can identify a classic classic bullish harami pattern on a price chart by looking for the following characteristics:
-
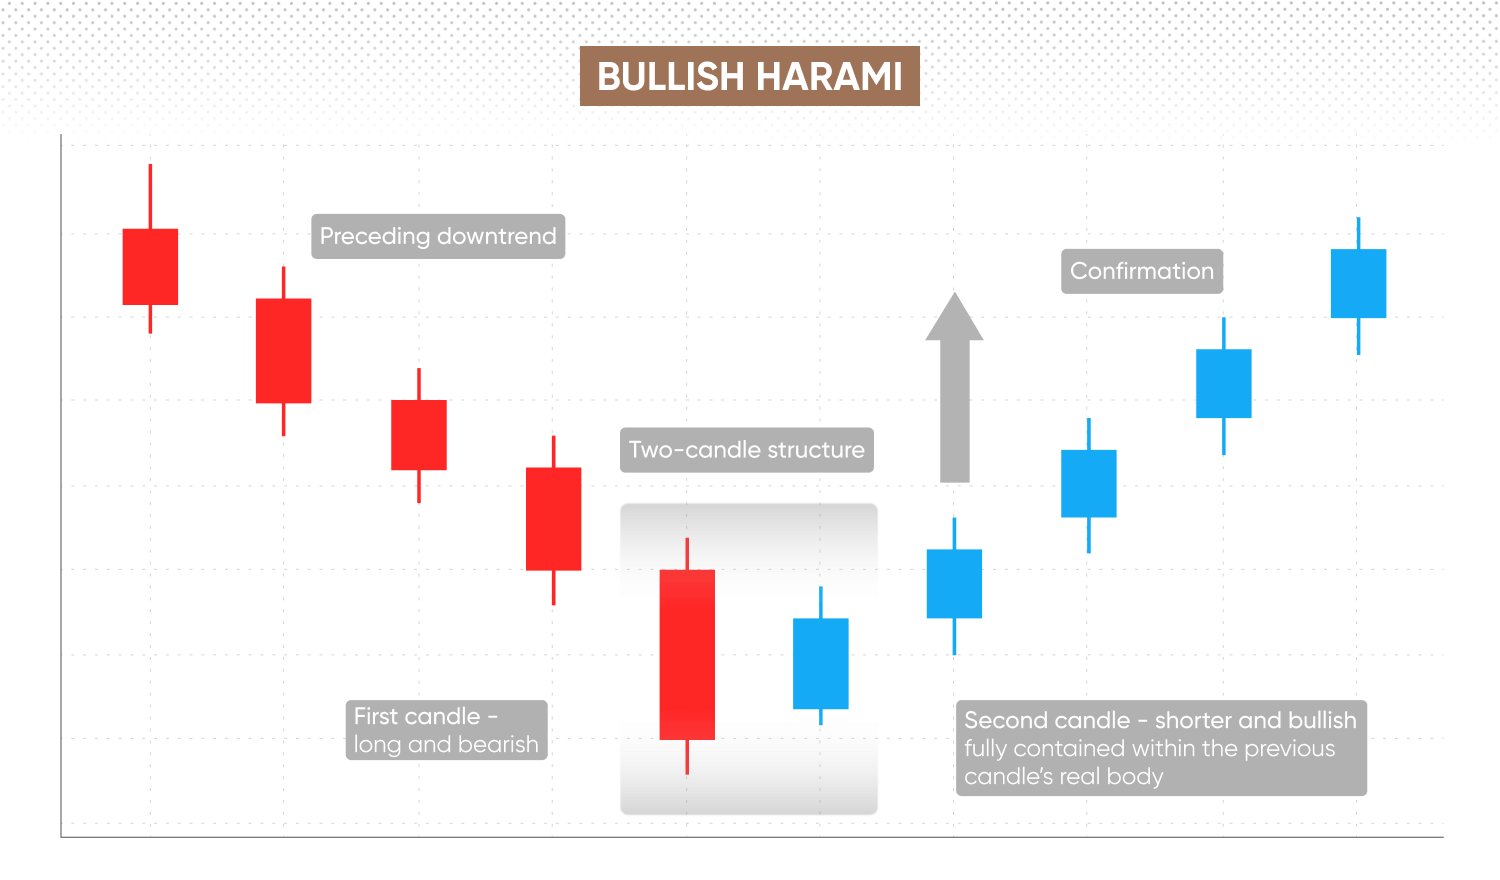
Prior downtrend – the harami pattern forms after a sustained decline. Verify that the market has been trending lower, establishing a clear bearish context before the pattern develops.
-
Two-candle structure – the first candle should display a long bearish body, reflecting strong selling pressure. The second candle should be smaller and bullish, with its real body entirely within the prior candle’s real body. Wicks may extend beyond, but the second candle’s body must be fully enclosed.
-
Size and placement – the second bullish candle’s body should be noticeably smaller than the first and fully contained within it, without extending beyond the first candle’s open or close.
-
Confirm the pattern – although a bullish harami points to a potential reversal, further evidence can reduce false signals. Such confirmation may come from a higher close on the next candle, increased volume, or a bounce off a key support level.
-
Validate the signal – to strengthen your analysis, consider combining candlestick patterns with other technical indicators – such as the relative strength index (RSI) or moving averages. Chart overlays, oscillators, or trendlines can help you measure the overall market context and the reliability of the potential reversal.
-
Review multiple timeframes – inspect the pattern on various intervals, such as daily or four-hour charts, to assess whether the bullish harami is likely to mark a meaningful trend change.
Bullish harami vs other reversal patterns
The bullish harami is one of several candlestick formations that traders use to spot potential market reversals such as the bullish engulfing pattern, morning star, and piercing pattern.
Here’s how they compare:
|
Potential signal |
Trading insight |
|
|
Bullish harami |
Small bullish candle entirely within the body of a larger bearish candle |
Signals initial seller hesitation, with potential reversal. |
|
Bullish engulfing |
Large bullish candle fully engulfs the previous bearish candle |
Stronger reversal indication, suggesting buyers have quickly regained control. |
|
Piercing pattern |
Bullish candle opens below prior close but closes above midpoint of previous bearish candle’s body |
Highlights emerging buyer strength after persistent selling pressure. |
|
Morning star |
Three-candle sequence: bearish candle, short-bodied candle, followed by strong bullish candle |
Indicates a clearer shift from selling to buying sentiment. |
-
The bullish harami is a two-candle pattern where a smaller bullish candle forms entirely within the body of a prior, larger bearish candle. This ‘inside’ structure differs notably from the bullish engulfing or piercing patterns.
-
A bullish engulfing consists of a large bullish candle completely covering the previous smaller bearish candle. The piercing pattern emerges when a bullish candle opens lower than the previous bearish close but recovers significantly, closing above the midpoint of the earlier candle’s body.
-
The morning star comprises three candles – a large bearish candle, a short-bodied candle (bullish or bearish), and a strong bullish candle closing deep within the first candle’s range.
CFD example of a bullish harami
While the bullish harami is a fairly straightforward pattern, viewing how it appears on live price charts can help clarify the key features to monitor.
Here’s an example of a bullish harami appearing on a forex CFD price chart:
GBP/USD forex CFD – bullish harami pattern
Formation
-
Suppose that the GBP/USD rate declines steadily across several sessions, culminating in a long bearish candle that opens at 1.2660 and closes at 1.2590 (high: 1.2670, low: 1.2575).
-
The following day, a smaller bullish candle opens at 1.2600 and closes at 1.2620, with its high at 1.2630 and low at 1.2595 – entirely contained within the real body and range of the prior day’s candle. The real body of the second candle sits well inside the first, with all price action fully enclosed.
Confirmation
-
The next session closes higher, hinting at renewed buying interest. Volume edges higher as price tests short-term support. Some traders wait for a close above the harami’s high or corroboration from a moving average before giving the signal greater weight.
Example strategy
-
A potential CFD trading strategy might be to enter a long position only after confirmation – for example, a higher close or increased volume. To help manage risk, a stop-loss* can be set just below the first candle’s low, and profit targets may reference nearby resistance or be managed with a trailing stop.
*Stop-loss orders aren’t guaranteed and may be subject to slippage during heightened volatility. Guaranteed stop-loss orders (GSLOs) incur a fee once activated.
This is a hypothetical scenario, and doesn’t reflect live prices. Past performance is not a reliable indicator of future results.
What is a bearish harami?
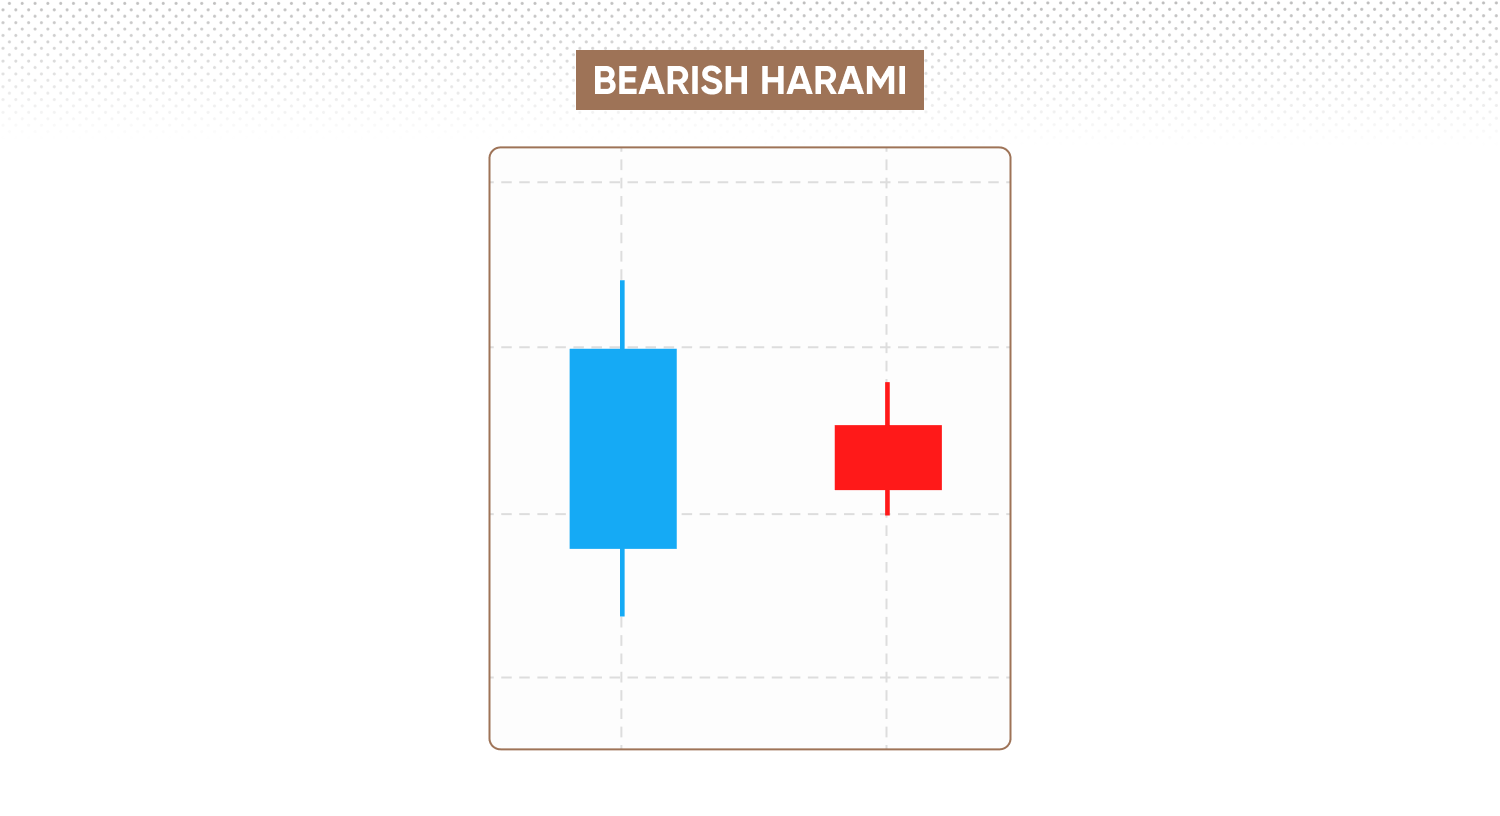
A bearish harami is the counterpart to the bullish harami pattern; instead of flagging a possible end to a downtrend, it forms within an uptrend and may signal a shift from bullish to bearish sentiment.
The structure consists of two candlesticks:
-
First, a long bullish candle, which reflects sustained buying pressure and upward momentum.
-
This is followed by a smaller bearish candle whose real body is entirely contained within that of the preceding bullish candle. Its wicks may extend beyond, but the body must remain enclosed.
What is a harami cross?
The harami cross is a variation of the standard harami pattern, characterised by a doji as the second candle. Instead of a small bullish or bearish body, the second candle opens and closes at nearly the same price, forming a cross-like shape on the chart.
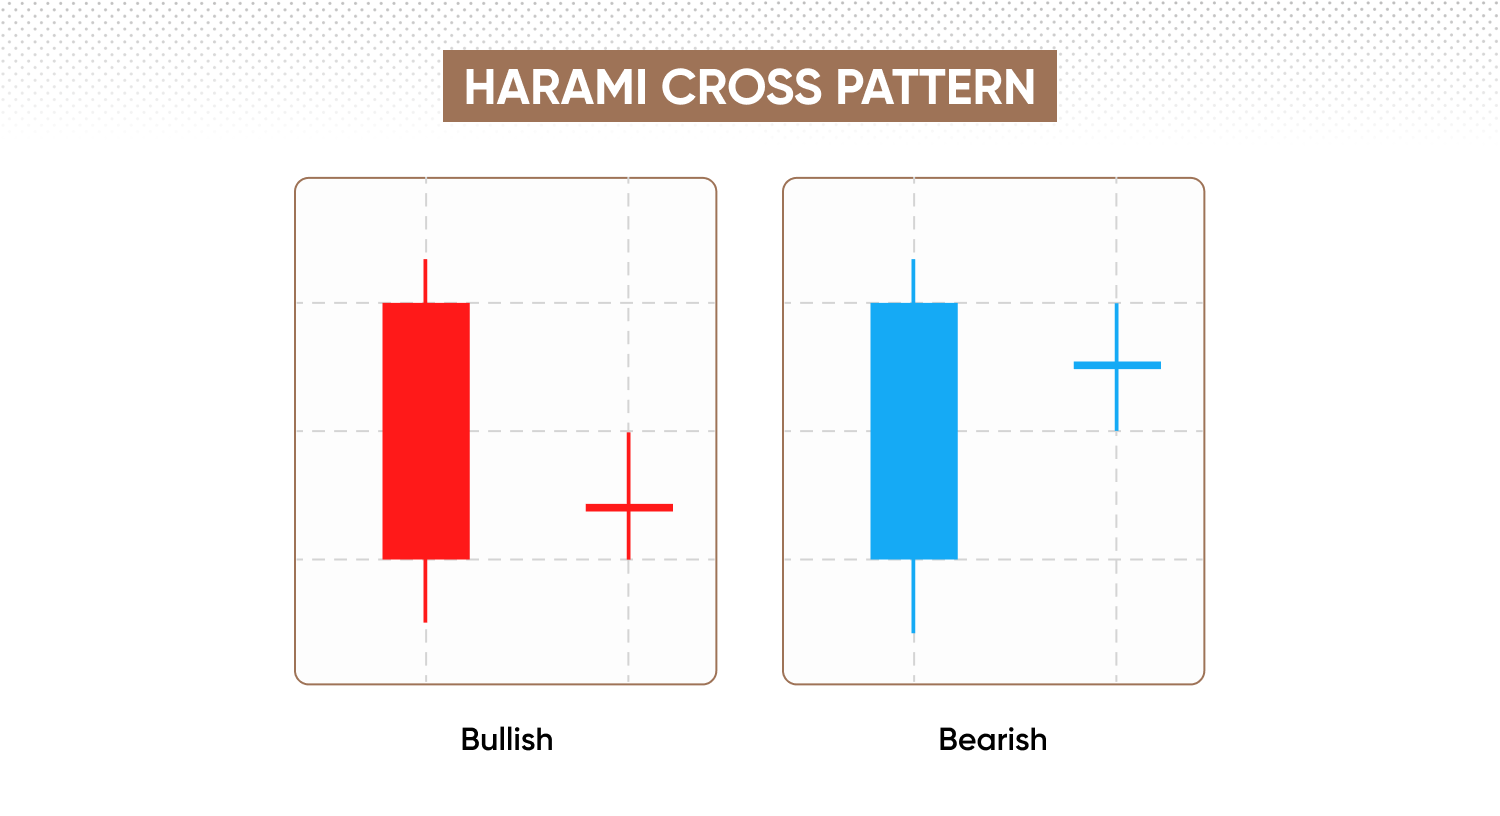
-
Bullish harami cross: appears after a downward move, with the first candle being a long bearish (red or black) real body, potentially signalling a bullish reversal.
-
Bearish harami cross: forms after an upward move, where the first candle is a long bullish (green or white) real body, suggesting a potential bearish reversal.
In both cases, the second candle is a doji, with the open and close almost identical. This creates a narrow, cross-shaped body that is visually distinct.
Explore more CFD trading chart patterns with our guide.
FAQ
Is a bullish harami always bullish?
A bullish harami pattern is typically seen as an early indication of a potential bullish reversal, especially when it appears after a clear downtrend. However, the pattern can fail, resulting in false signals. Use technical indicators for additional confirmation, and assess evolving market conditions. Past performance isn’t a reliable indicator of future results.
How reliable is the bullish harami pattern?
Reliability can vary depending on market context and the approach to identification. The bullish harami is considered more effective when it forms at established support levels and is accompanied by increased trading volume or other confirming indicators. Its reliability also depends significantly on a trader's interpretation and confirmation from subsequent price movements. Like all chart patterns, it does not guarantee results and can produce false signals, particularly in sideways or low-volume markets.
What is the difference between a bullish harami and a bullish engulfing pattern?
Both patterns are used to spot potential reversals, but their structures differ. In a bullish harami, the second candle’s body is contained within the first. Conversely, a bullish engulfing pattern features a larger bullish candle that fully engulfs the previous bearish candle’s real body, typically viewed by traders as providing a more robust reversal indication.
Can a bullish harami form in any market condition?
A bullish harami can technically appear in any market, but it holds the most weight when it follows a sustained downtrend. In sideways or indecisive conditions, its significance tends to diminish, and the risk of false signals typically increases. Traders may require further evidence before making decisions.
What typically follows a bullish harami pattern?
If confirmed by subsequent bullish price action or supporting analysis, some traders may anticipate a shift to upward momentum. However, reversals are not guaranteed, and prices may consolidate or even resume the previous trend. Consistent risk management and further confirmation remain important.
Does the bullish harami pattern suit all timeframes?
The bullish harami can be identified across multiple timeframes, from intraday to daily charts. Its reliability may improve on higher timeframes due to reduced market noise, but effectiveness still largely depends on broader market context and supporting evidence.