The FOMC tipped to cut but guidance and projections to decide whether traders get their “Santa Rally”
The Fed may be the difference between and Santa Rally or a holiday fizzer.
The FOMC hands down its final rate decision for the year on the 10th of December, 2025 and is widely tipped to cut rates.
Futures markets suggest a rate cut is all but certain
The markets are pricing in that a cut from the FOMC is all but certain at its final meeting of 2025. A day from the decision, the CME’s FedWatch tool implies a roughly 90% chance of a rate reduction, a pricing that the Fed is unlikely not to respect having not pushed back on it prior to the pre-meeting blackout period. The pricing follows a short-period of volatility in the rates market after the central bank’s last meeting. While still cutting rates, Chairperson Jerome Powell stated in his post-meeting presser that a December cut was “not a foregone conclusion”, with the balance of risks to the US economy two-sided. The dynamic saw the odds of a cut fall to a low of roughly 30%, before rebounding to current levels thanks to dovish commentary from two noted policy doves, Christopher Waller and John Williams.
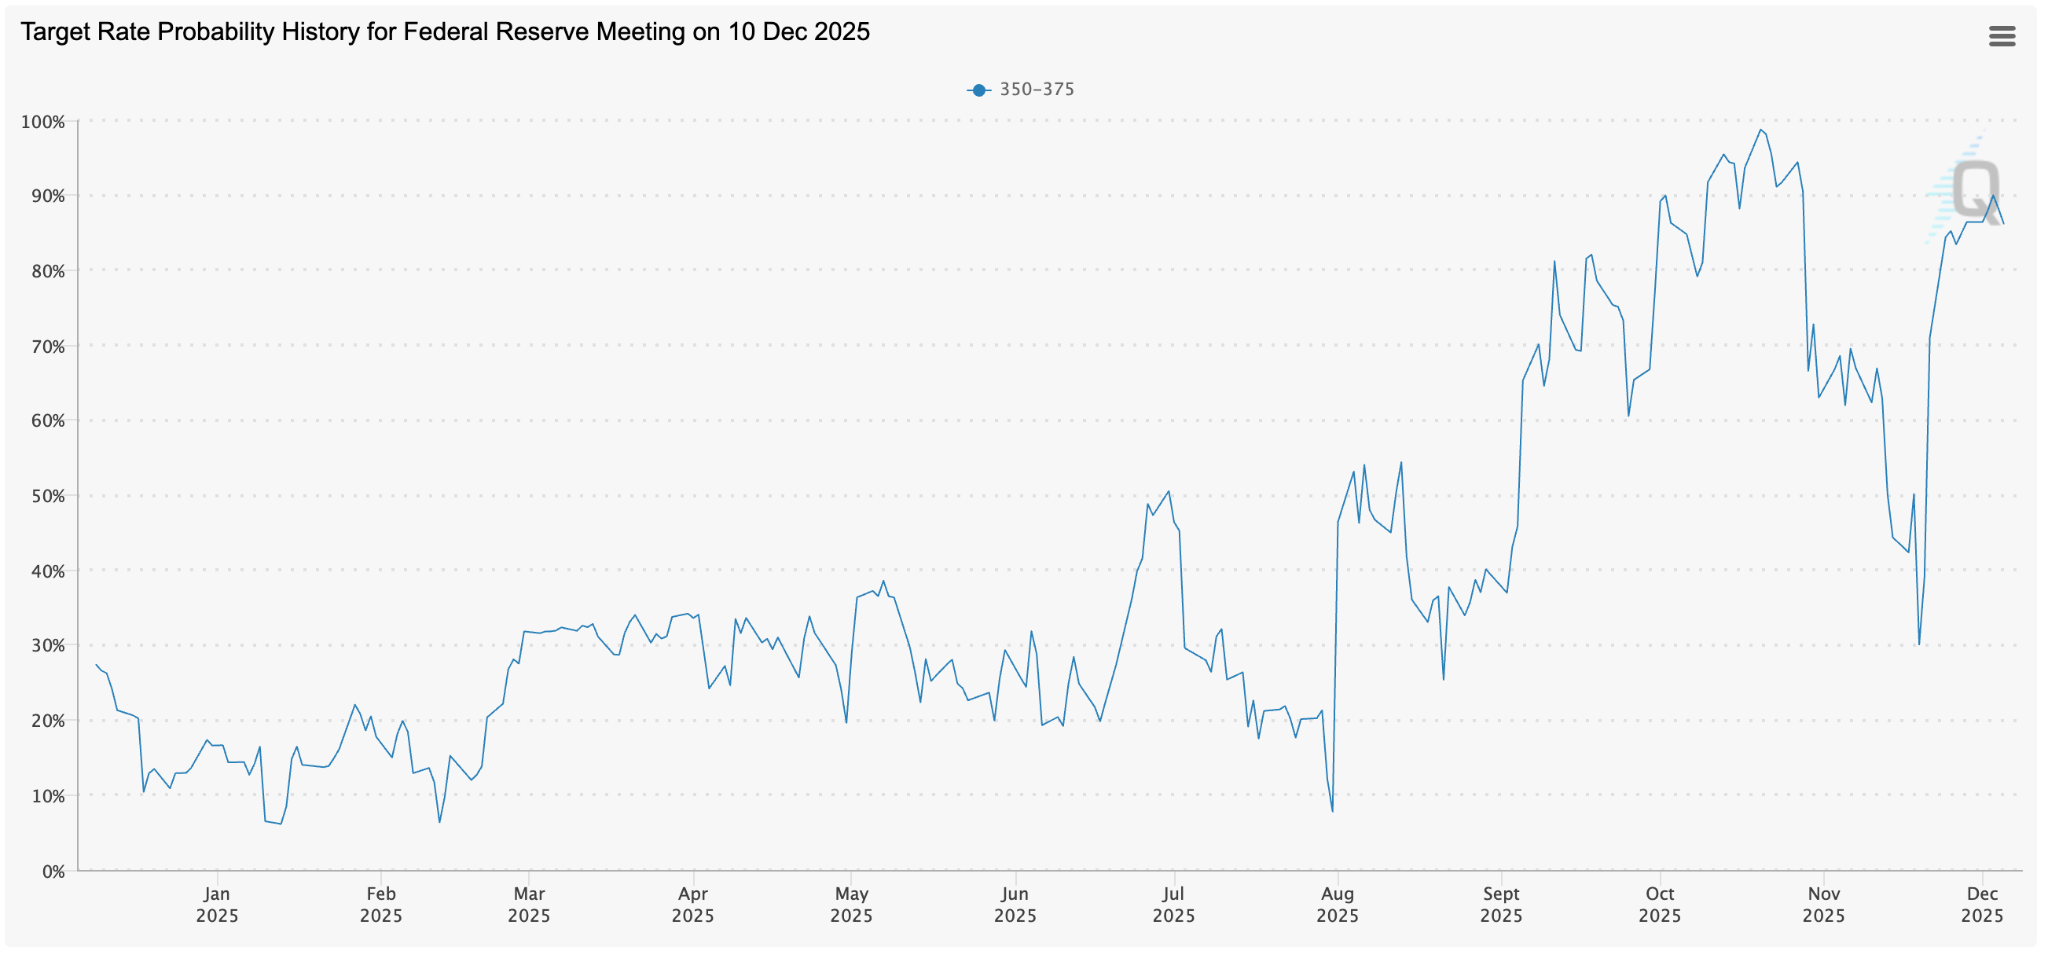
(Source: CME Group)
Adding to the market volatility leading into this Fed decision was the lack of substantial data market participants and policy makers had at their disposal. The US government shut down all but shut-off the flow of official data, meaning the markets and Fed officials were flying blinkered, if not blind, between the October and December Fed meetings. Some private data, like the ISM surveys and ADP private payrolls report, revealed sluggishness in the labour market and subsiding price pressures in the US economy. While there’s not been an updated labour force report – the next will be belatedly released a week after the Fed decision – or timely inflation release, the data appears to have led the markets to believe the path of least regret for the Fed at this meeting is to cut rates and then reassess.
The Fed’s guidance will drive or deny “Santa Rally”
Given the high probabilities of a rate cut at this FOMC decision, the markets – and whether Wall Street gets a feted Santa Rally – will likely come down to the Fed’s guidance. The post-meeting presser will be watched for any more tough-talk by Powell about two-sided risks to the economy, while the updated Summary of Economic Projections will be dug into for fresh labour market and inflation forecasts and the updated “dot plots”. There are several pressing questions…
- Will this be a consensus decision or one riddled with dissenters?
- Will the dissenters go both ways, some voting for a hold, some for a cut, and some for a bigger cut?
- Will the Fed again caution the markets against “foregone conclusions” regarding future cuts?
- Will the Fed’s Summary of Economic Projections reveal a set of dot plots that drops in line with market pricing?
- Will the markets put any weight on these things at all given the Powell Fed only has three more meetings left in it after this one?
Ultimately, though, there’s two pertinent pain points for the markets. First, will the Fed’s guidance and projections be dovish and bring the central bank in line with what the markets are pricing in for future policy, i.e. deeper rate cuts? Second, if the Fed doesn’t do this, will the markets shrug it off given Powell will be replaced in May, likely by a much more dovishly inclined chairperson? Both could support a rally in equities, possibly gold and a drop in the US Dollar as the markets price in the higher odds of further cuts next year. If the Fed delivers a “hawkish hold” and the markets buy into it, it could weigh on risk assets and potentially boost yields and the Dollar.
The S&P 500 hovers below record highs heading into decision
Volatility has settled heading into the upcoming Fed decision, conveying a possible complacency in the markets. Price action points to a holding pattern for the markets as they await a catalyst from the Fed. The S&P 500 is just below record highs and a critical juncture. A Fed induced rally could see the index re-test resistance at record highs at about 6920, a break of which would be a bullish signal and invite further buying. However, a sell-off could represent a lower high for the index and raise serious questions about toppiness in the markets. The break of an upward sloping trendline could spark a pull back towards the 50-day moving average around 6750. In the bigger picture, 6520 is the major support line that could raise serious doubts about Wall Street’s bull market if broken.
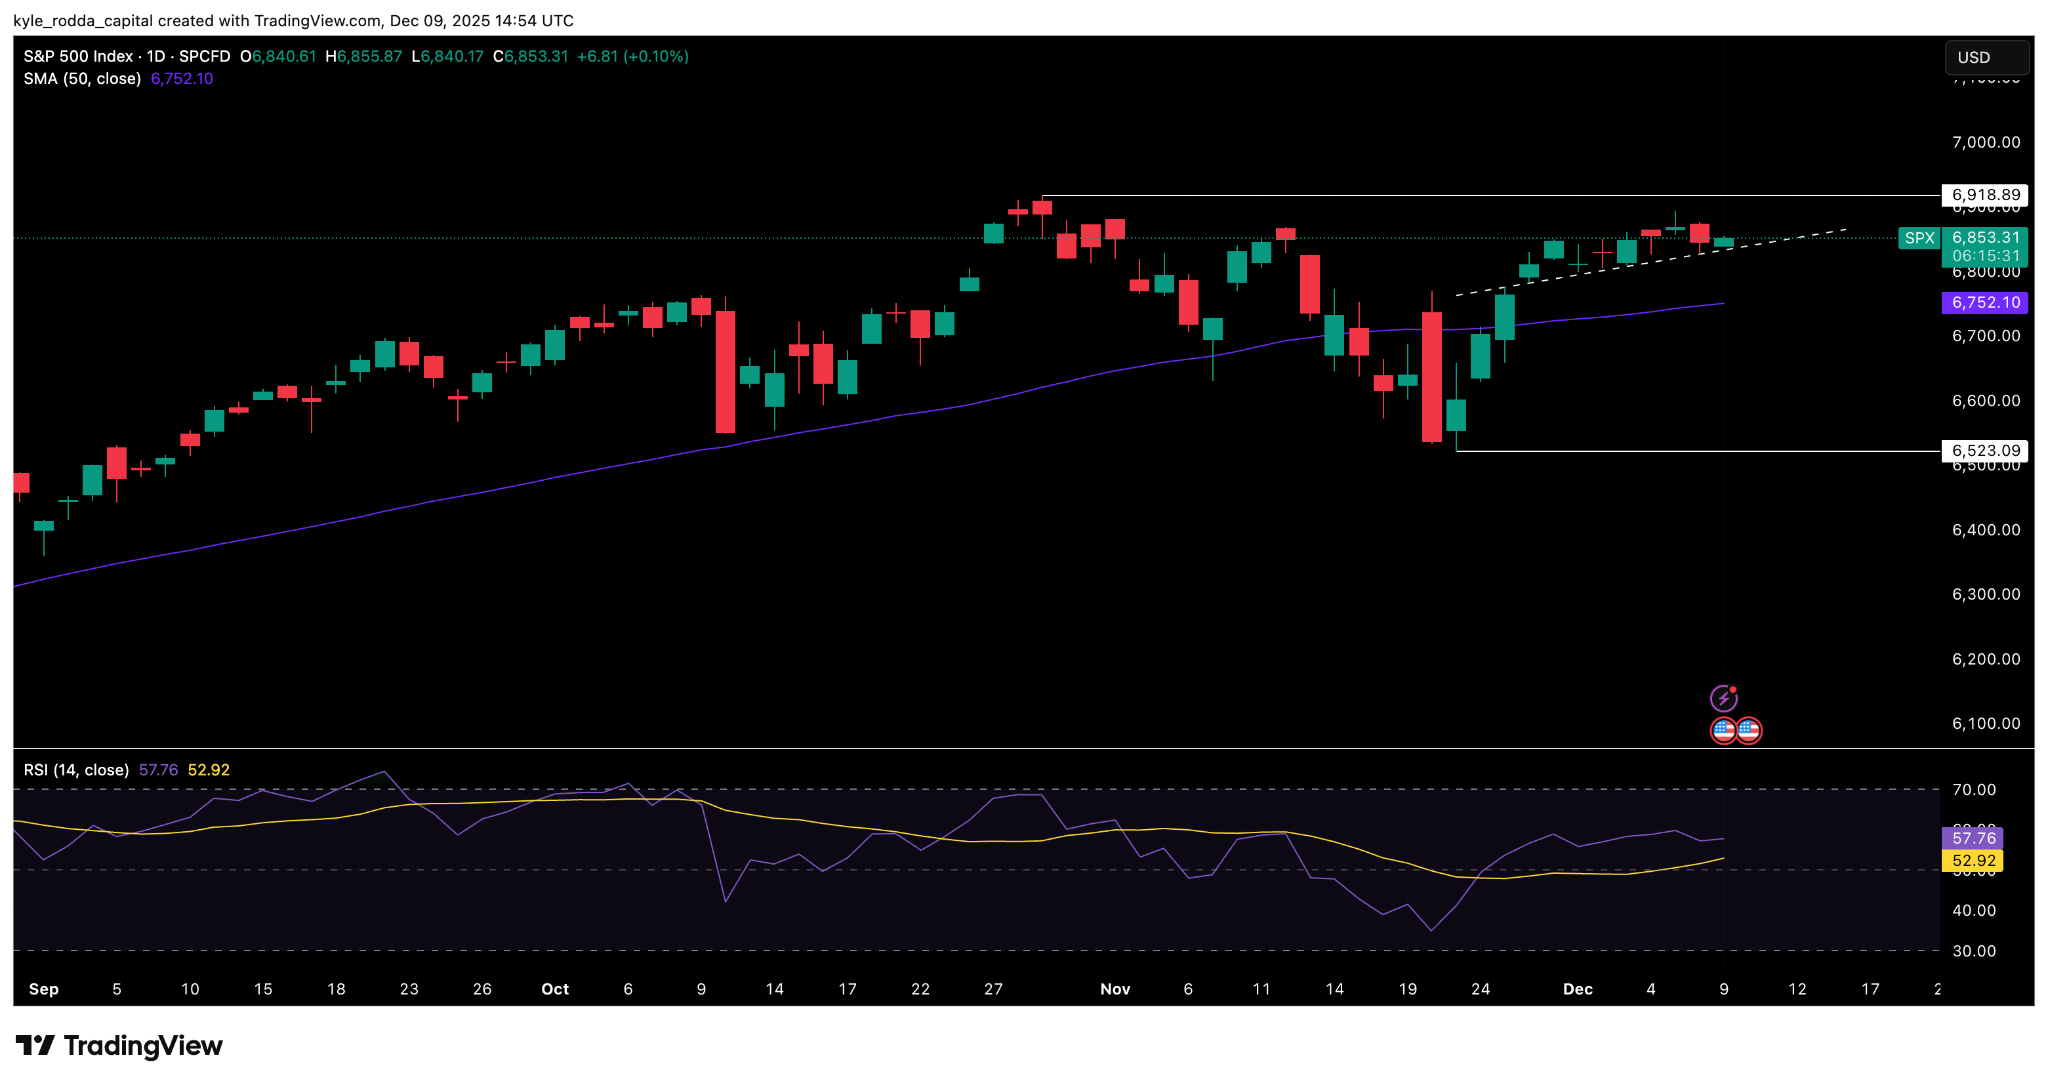
(Source: Trading View)
(Past performance is not a reliable indicator of future results)