Vinci stock forecast: Third-party price targets
VINCI announced a German heavy-vehicle charging contract on 9 July 2026, adding to recent corporate updates as Vinci shares traded near €119.42. Explore third-party DG price targets and technical analysis. Past performance is not a reliable indicator of future results.
VINCI SA (DG) last traded at €119.42 around 1:14pm UTC on 13 July 2026, within an intraday range of €118.13–€120.22. Past performance is not a reliable indicator of future results.
Trading coincided with recent corporate activity. VINCI announced on 9 July 2026 a contract to install and operate charging stations for heavy vehicles in Germany, following an eight-year agreement disclosed the same week (VINCI, 9 July 2026). The move also came against a broader capital markets backdrop, with Euronext recording a capital increase notice for VINCI shares on 10 July 2026 (Euronext, 10 July 2026), while wider French equities showed mixed performance heading into mid-July trading (MarketScreener, 10 July 2026).
Third-party VINCI outlook: charging contract, H1 results near
As of 13 July 2026, third-party VINCI stock predictions reflect diverging views on the group's airport exposure and construction order book. The following mini-briefs summarise broker calls and consensus estimates captured within this period.
J.P. Morgan (broker rating)
J.P. Morgan analyst Elodie Rall maintained a Hold rating on Vinci SA and set a price target of €139 in a note dated 4 July 2026. The call reflected caution around the group's airport traffic trajectory, following a slower growth outlook flagged for the rest of the year (The Globe and Mail, 4 July 2026).
MarketScreener (consensus estimate)
MarketScreener's consensus put Vinci's average 12-month target price at €142.93 as of 12 July 2026, with the spread to the average target at +19.76% versus the prevailing share price. The estimate followed the company's first-quarter 2026 disclosure of stable revenue and higher order intake (MarketScreener, 12 July 2026).
eToro (consensus estimate)
eToro reported an average analyst price target of €144.86 for Vinci SA as of 5 July 2026, alongside an overall Moderate Buy consensus. The target drew on aggregated broker inputs as analysts weighed mixed signals across the group's concessions and construction segments (eToro, 5 July 2026).
Kepler Cheuvreux (broker upgrade)
Kepler Cheuvreux upgraded Vinci SA to Buy from Hold and raised its price target to €146.50 from €143 as of 9 July 2026. The broker said recent share-price weakness had created, in its view, an attractive entry point despite near-term market concerns (Investing.com, 9 July 2026).
Simply Wall St (valuation note)
Simply Wall St's discounted cash flow model suggested Vinci may have been trading around 10% above its intrinsic value estimate as of 10 July 2026, while separate multiple-based comparisons suggested the shares screened as undervalued against peers. The mixed valuation signals reflect the different weightings placed on cash flow assumptions and peer multiples (Yahoo Finance, 10 July 2026).
Predictions and third-party forecasts are inherently uncertain, as they cannot fully account for unexpected market developments. Past performance is not a reliable indicator of future results.
Vinci earnings: latest results and upcoming release
VINCI's most recently published financial results covered the first quarter of 2026, disclosed on 22 April 2026 in the company's own press release (VINCI, 23 April 2026). Consolidated revenue was €16.3bn, which the company described as 'stable revenue at a high level' (Investing.com, 23 April 2026). This represented a 1% increase at constant exchange rates and a 0.3% decline on an actual basis (Investing.com, 24 April 2026).
Order intake reached €17.4bn, up 5% year on year, taking the group's total order book to a record €74.9bn as of 31 March 2026, an increase of 4% from the prior year (Investing.com, 24 April 2026). Performance varied by business line, with Energy Solutions revenue rising to €6.9bn and Concessions revenue increasing to around €2.6bn, while Construction revenue declined to €6.9bn (Investing.com, 23 April 2026).
Net financial debt stood at €19.1bn as of 31 March 2026, while managed net cash rose to €15.5bn, up €3.8bn year on year. Following the results, VINCI kept its full-year 2026 guidance unchanged, saying it continued to expect growth in revenue, operating earnings, and net income attributable to owners of the parent (Investing.com, 24 April 2026).
VINCI's next scheduled earnings release covers first-half 2026 results, due on 29 July 2026. An earnings call is scheduled for 30 July 2026, according to the company's financial calendar, while a separate traffic and revenue update for June 2026 is scheduled for 16 July 2026 (MarketScreener, 13 April 2026).
DG stock price: technical overview
On the daily chart as of 1:14pm UTC on 13 July 2026, the DG stock price was trading at €119.42, below its key moving-average cluster. The 20-, 50-, 100- and 200-day moving averages (DMAs) stood near €126, €126, €129 and €125, respectively. With price below that broader band, the near-term setup remained cautious rather than constructive. The 200-day EMA was slightly below the 200-day SMA at around €125, offering a nearby long-term reference level.
Momentum also appeared soft, with the 14-day relative strength index at 36.56, in lower-neutral territory rather than oversold. The average directional index (14) stood at 21.49, below the 25 threshold typically associated with an established trend, suggesting directional conviction remained limited.
The classic pivot point at €127.13 sat above the last quoted price, with R1 at €132.87 and R2 at €137.93 forming the next upside reference levels. The 200-day SMA near €124.82 also sat above the latest price, so traders would need an updated support framework before treating these levels as downside references (TradingView, 13 July 2026).
This technical analysis is for informational purposes only and does not constitute financial advice or a recommendation to buy or sell any instrument.
VINCI share price history (2024–2026)
DG’s stock price have traded across a wide range over the past two years, moving from around €105.63 in mid-July 2024 to €119.22 as of 13 July 2026.
The stock spent late 2024 edging higher from the low €100s, before slipping to a two-year low of €96.36 on 27 November 2024 amid broader market uncertainty. A recovery through early 2025 carried the shares back above €120, before global trade tensions weighed on sentiment. Vinci fell to €106.06 on 9 April 2025, during the tariff-driven selloff linked to the US administration’s ‘Liberation Day’ announcements.
From there, the stock rose through the second half of 2025 and into 2026, peaking at €143.65 on 27 February 2026 – its highest level of the period – before easing back through spring and summer as the shares consolidated.
Vinci closed at €119.22 on 13 July 2026, roughly 0.6% lower year to date from its €119.97 close on 31 December 2025, and around 5.3% lower year on year versus €125.83 a year earlier.
Past performance is not a reliable indicator of future results. Share prices are indicative and may differ from live market prices.
VINCI (DG): Capital.com analyst view
Vinci’s share price performance over the past two years has reflected a mix of resilience and volatility. The stock climbed from the low €100s in mid-2024 to a two-year peak above €143 in late February 2026, before easing back to trade near €119 in mid-July 2026.
During that period, the company reported steady order intake across its construction and energy solutions divisions, alongside record levels in its overall order book. At the same time, the shares showed sensitivity to broader macro shocks, including the decline seen in April 2025 amid global trade tensions. This suggests that external policy developments can affect infrastructure-linked equities alongside company-specific fundamentals.
Looking ahead, some market participants point to Vinci’s diversified exposure across construction, concessions, and energy transition projects as a potential source of stability. Others highlight risks tied to airport traffic trends and elevated net financial debt, which could pressure margins if borrowing costs stay higher for longer. Analyst price targets vary accordingly, reflecting different weightings placed on these offsetting considerations rather than a single consensus view.
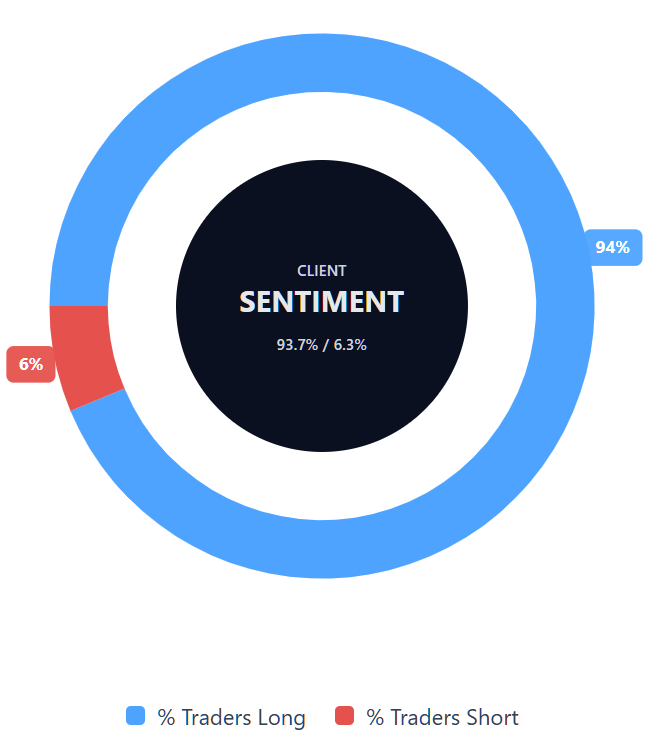
Capital.com’s client sentiment for VINCI CFDs
As of 13 July 2026, Capital.com client positioning in VINCI CFDs shows 93.7% buyers compared with 6.3% sellers, a gap of 87.4 percentage points. This snapshot reflects open positions on Capital.com and can change as market conditions evolve. Client sentiment is not a forecast and should not be used as the sole basis for any trading decision.
Summary – VINCI 2026
- As of 1:14pm UTC on 13 July 2026, Vinci (DG) traded near €119.42, below its two-year peak of €143.65 in February 2026 but above July 2024 levels.
- Technical indicators on TradingView show the price below its key moving-average cluster, with RSI in lower-neutral territory and ADX signalling limited trend conviction.
- Factors to watch include order intake trends, airport traffic growth, energy transition project wins, and sensitivity to broader macro and trade policy developments.
- Recent attention centres on the group’s German EV charging contract, its half-year results release due on 29 July 2026, and mixed analyst price target revisions.
Past performance is not a reliable indicator of future results.
FAQ
Who owns the most Vinci stock?
According to VINCI’s latest shareholding breakdown, institutional investors are the largest holder category, accounting for 73% of share capital at 31 December 2025. Individual investors represented 11.6%, employees 11.3% and treasury shares 4.4%. This means ownership is widely distributed rather than concentrated in a single named holder. Investors should check VINCI’s latest regulatory filings and shareholder disclosures, as holdings can change over time.
What is the five-year Vinci share price forecast?
The article does not provide a verified five-year DG stock forecast. It focuses on third-party analyst targets captured between 25 June 2026 and 13 July 2026, which mainly clustered between €139 and €146.50. Longer-term forecasts can vary widely because they depend on assumptions about airport traffic, construction demand, energy transition projects, debt costs and wider macro conditions. Forecasts are not guarantees of future performance.
Is Vinci a good stock to buy?
Whether Vinci is a good stock to buy depends on your financial goals, risk tolerance, market view and existing portfolio. The article notes factors that may support the business, including diversified exposure across construction, concessions and energy transition projects. It also highlights risks, including airport traffic trends, elevated net financial debt and sensitivity to broader macro shocks. Traders should consider both sides and do their own research before making any decision.
Could Vinci stock go up or down?
Yes. Vinci stock could move in either direction, depending on company-specific results and wider market conditions. Potential upside factors include stronger order intake, improved airport traffic, new infrastructure contracts and supportive analyst revisions. Potential downside risks include weaker concession performance, higher borrowing costs, trade-policy uncertainty or a broader equity-market pullback. Technical indicators in the article also showed the price below key moving averages, with limited trend conviction at the time of writing.
Should I invest in Vinci stock?
Only you can decide whether Vinci stock fits your financial circumstances, objectives and appetite for risk. The article is designed to provide market context, not investment advice. It summarises recent price action, third-party analyst targets, earnings data, technical indicators and client sentiment. Before investing, consider reviewing VINCI’s financial reports, comparing it with sector peers and assessing how a position would affect your overall exposure to equities and infrastructure-linked assets.
Can I trade Vinci CFDs on Capital.com?
Yes, you can trade VINCI CFDs on Capital.com. Trading share CFDs lets you speculate on price movements without owning the underlying asset and to take long or short positions. However, contracts for difference (CFDs) are traded on margin, and leverage amplifies both profits and losses. You should ensure you understand how CFD trading works, assess your risk tolerance, and recognise that losses can occur quickly.