Oracle stock forecast: $7bn US Defense cloud deal
Oracle is a US technology company whose cloud business is in focus after it signed a $7bn infrastructure deal with the US Department of Defense. Explore third-party ORCL price targets and technical analysis. Past performance is not a reliable indicator of future results.
Oracle Corporation (ORCL) is trading near $123.38 in early European trading as of 8.58am UTC on 24 July 2026, after moving within an intraday range of $119.58–$126.75. Past performance is not a reliable indicator of future results.
The move follows news that Oracle signed a $7bn cloud infrastructure deal with the US Department of Defense, extending its recent series of large-scale cloud contracts (CNBC, 23 July 2026). Market attention also remains on capital expenditure across the cloud and AI infrastructure sector, as investors assess Oracle's Remaining Performance Obligations, its contracted future revenue, disclosed in the latest quarterly results (Oracle, 10 June 2026).
Third-party Oracle outlook: Pentagon deal and price targets
As of 24 July 2026, third-party Oracle stock predictions point to a wide range of price levels over the next 12 months. Expectations centre on cloud infrastructure growth, AI-linked capital spending and the pace at which Oracle converts its backlog into revenue and cash flow.
Finbold (individual broker forecast)
Finbold reports that Piper Sandler analyst Billy Fitzsimmons maintained an Overweight rating on Oracle and a 12-month price target of $225, representing potential upside of more than 60% from the $140.27 share price cited at the time. According to the note, the reiterated target reflected confidence in Oracle's cloud infrastructure contract pipeline (Finbold, 6 July 2026).
24/7 Wall St. (base and bull-case scenarios)
24/7 Wall St. projects a base-case 12-month target of $211.32, representing potential upside of 47% from a cited share price of $143.76, with a bull-case estimate of $350.29 and a bear-case estimate of $184.26. The publication states that a move to $400 would require a re-rating to a forward price-to-earnings multiple of about 43 times, based on forward earnings-per-share estimates of $9.30 (24/7 Wall St., 8 July 2026).
Investing.com (consensus estimate)
Investing.com projects an average 12-month price target of $251.85, based on estimates from 40 analysts, with forecasts ranging from $155 to $400 and the average representing potential upside of 77.86% from the prevailing price cited by the source. The consensus reflects a mix of analyst ratings weighted towards Buy (Investing.com, 20 July 2026).
Public.com (consensus overview)
Public.com projects a 12-month price target of $271.88 based on coverage from 34 analysts, with a consensus Buy rating comprising 35% Strong Buy and 47% Buy recommendations. The publication notes that forecasts and ratings may change as new earnings data and industry developments emerge (Public.com, 20 July 2026).
MarketBeat (consensus estimate)
MarketBeat projects an average 12-month price target of $265.03, with estimates ranging from $145 to $400. The spread reflects differing expectations about how quickly Oracle's cloud backlog may convert into future free cash flow (MarketBeat, 22 July 2026).
Predictions and third-party forecasts are inherently uncertain, as they cannot fully account for unexpected market developments. Past performance is not a reliable indicator of future results.
Oracle earnings: latest results and upcoming report
Oracle reported its fourth-quarter and full-year 2026 results on 10 June 2026. The company posted non-GAAP earnings per share of $2.11, ahead of a consensus estimate of $1.96 (Oracle, 10 June 2026).
Quarterly revenue rose 21% year on year to $19.2bn, led by continued growth in cloud revenue (Oracle, 10 June 2026). For the full fiscal year, total revenue increased 17% to a record $67.4bn, while cloud revenue rose 39% to $34bn. Non-GAAP operating income increased 16% to a record $28.9bn (Oracle, 10 June 2026).
Total Remaining Performance Obligations, which measure contracted future revenue, rose by $85bn during the quarter, from $553bn to $638bn. Oracle's board also declared a quarterly cash dividend of $0.50 per share, payable on 24 July 2026 to shareholders of record on 10 July 2026 (Oracle, 10 June 2026).
Oracle has not formally confirmed its next earnings release date. Based on previous reporting patterns, market data providers estimate that the company could publish its first-quarter 2027 fiscal-year results around 8 September 2026, though the date remains unconfirmed (MarketBeat, 21 July 2026).
ORCL stock price: technical overview
As of 8.58am UTC on 24 July 2026, the ORCL stock price traded near $123.38, below the 20-, 50-, 100- and 200-day simple moving averages (SMAs) of about 136, 173, 167 and 188, respectively. This places the price below all four cited moving averages.
The 20-day exponential moving average (EMA), near 139, also sits above the current price. Meanwhile, the 20-day SMA remains below the 50-day SMA, indicating a downward trend under this measure.
TradingView’s momentum readings show the 14-day relative strength index (RSI) at 29.63, below the conventional oversold threshold of 30. The 14-day average directional index (ADX) stands at 39.58, indicating a comparatively strong trend without identifying its direction.
The stochastic %K reading of 15.40 also sits within the indicator’s conventional oversold range.
On the upside, the classic R1 pivot near 216 sits well above the current price. A move above this level could bring the R2 pivot near 286 into focus under the indicator’s framework.
The classic pivot point near 180 also sits above the current price, while the 100-day SMA near 167 and the S1 pivot near 111 provide further reference levels. A move below S1 could shift attention towards lower pivot levels, although technical indicators cannot determine future price movements with certainty (TradingView, 24 July 2026).
This technical analysis is for informational purposes only and does not constitute financial advice or a recommendation to buy or sell any instrument.
Oracle share price history (2024–2026)
ORCL’s stock price rose from about $137.95 in late July 2024 to an all-time closing high of $324.63 on 10 September 2025, during a period of increased market interest in cloud and AI infrastructure spending.
The stock later traded at $257.04 in early November 2025 before easing towards year-end and closing 2025 at $194.39 (Macrotrends).
Price movements widened in 2026. Oracle opened the year near $195.53 and rose to $250.38 in early June around the release of its fiscal fourth-quarter results. It then declined through the summer as market participants assessed AI-related capital expenditure and cloud margins.
The shares fell from $211.55 on 8 June to $180.94 by 10 June and continued lower through July, reaching an intraday low of $119.51 on 23 July.
Oracle traded at $123.64 on 24 July 2026, about 36.7% below its level at the start of the year. It remained well below the September 2025 high and, based on the figures cited, also below the $137.95 closing price recorded on 24 July 2024.
The price history shows how changing expectations around AI-linked growth, cloud demand and capital expenditure have influenced Oracle’s valuation.
Past performance is not a reliable indicator of future results. Share prices are indicative and may differ from live market prices.
Oracle (ORCL): Capital.com analyst view
Oracle’s share-price performance in 2026 has featured pronounced volatility, with the stock moving from a 2026 high near $250 in early June to lows around $119 by late July.
The decline followed strong gains through much of 2025, when expectations around cloud infrastructure and AI-linked contracts supported the shares. Sentiment later shifted as market participants placed greater scrutiny on the pace and profitability of AI-related capital spending.
The recent pullback has also coincided with debate over how quickly Oracle can turn its expanding contracted revenue backlog into cash flow. Some market participants may view lower price levels more favourably, while others may focus on the uncertainty created by the company’s capital expenditure commitments. Neither view indicates a certain outcome.
Factors that could support Oracle’s outlook include continued cloud infrastructure growth and further large-scale contract wins. These need to be weighed against risks such as margin pressure from data-centre construction costs, execution challenges and wider changes in sentiment towards AI-related equities.
Sharp price movements can increase both potential gains and potential losses for CFD traders. Past performance isn’t a reliable indicator of future results, and Oracle’s share price may continue to respond to changing expectations across the cloud and AI infrastructure sector.
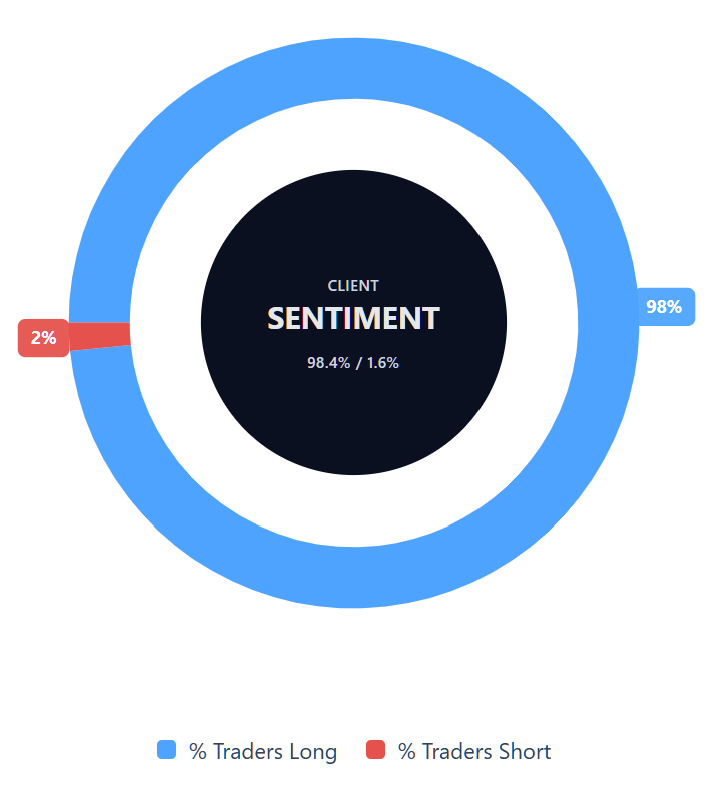
Capital.com’s client sentiment for Oracle CFDs
As of 24 July 2026, Capital.com client positioning in Oracle CFDs is heavily skewed, with 98.4% of open positions long and 1.6% short. Long positions therefore lead by 96.8 percentage points among Oracle positions on the platform.
This data represents a snapshot of open positions on Capital.com and may change. Client sentiment isn’t an indicator of future market performance and shouldn’t be used in isolation when making trading decisions.
Summary – Oracle 2026
- Oracle traded near $123.38 at 8.58am UTC on 24 July 2026, below both its 2025 high of $324.63 and its level at the start of 2026.
- Technical indicators placed the price below several key moving averages. The RSI stood at 29.63, within the conventional oversold range, while the ADX indicated an established trend without independently confirming its direction.
- Factors influencing the stock include cloud infrastructure growth, Oracle’s expanding contracted revenue backlog, AI-related capital expenditure and potential pressure on margins.
- Recent developments include a $7bn US Department of Defense cloud contract, Oracle’s fiscal 2026 results and its reported $638bn in Remaining Performance Obligations.
Past performance is not a reliable indicator of future results.
FAQ
Who owns the most Oracle stock?
The article doesn’t identify Oracle’s largest shareholder. Ownership data can also change as institutional investors, company insiders and other shareholders adjust their positions. To confirm the latest ownership structure, readers would need to consult Oracle’s regulatory filings or a current institutional holdings database. Shareholder concentration may influence market interest, but it doesn’t determine how Oracle’s share price will perform.
What is the five-year Oracle share price forecast?
The article only covers analyst forecasts for the next 12 months, not a five-year ORCL stock forecast. Those estimates vary widely, with published targets ranging from $145 to $400. A five-year forecast would involve greater uncertainty because Oracle’s future performance could depend on cloud growth, AI-related capital expenditure, margins, contract execution and wider market conditions. Longer-term projections should therefore be treated as scenarios rather than reliable outcomes.
Is Oracle a good stock to buy?
Whether Oracle is suitable to buy depends on an individual’s objectives, risk tolerance and financial circumstances. The article highlights potential supporting factors, including cloud infrastructure growth, large contract wins and a substantial contracted revenue backlog. It also outlines risks, such as high capital expenditure, margin pressure, execution uncertainty and changing sentiment towards AI-related equities. None of these factors can confirm whether the share price will rise or fall.
Could Oracle stock go up or down?
Yes. Oracle’s share price could move in either direction. Factors that may support the price include cloud revenue growth, new infrastructure contracts and progress in converting backlog into cash flow. Downside risks include weaker margins, higher data-centre costs, slower-than-expected contract delivery and shifts in market sentiment. Technical indicators may identify trends or reference levels, but they can’t predict future price movements with certainty.
Should I invest in Oracle stock?
The article doesn’t provide investment advice or recommend buying Oracle shares. Any decision would require consideration of Oracle’s financial results, valuation, growth outlook and company-specific risks, alongside personal circumstances and investment objectives. The stock has also experienced significant volatility, which may increase both potential gains and losses. Past performance isn’t a reliable indicator of future results, and analyst forecasts can change as new information becomes available.
Can I trade Oracle CFDs on Capital.com?
Yes, you can trade Oracle CFDs on Capital.com. Trading share CFDs lets you speculate on price movements without owning the underlying asset and to take long or short positions. However, contracts for difference (CFDs) are traded on margin, and leverage amplifies both profits and losses. You should ensure you understand how CFD trading works, assess your risk tolerance, and recognise that losses can occur quickly.