Trading the Dow 30 Ahead of Earnings from the Financial Heavyweights
Most of the losses since the start of the conflict have been undone even as oil prices remain high, and in sentiment CoT speculators have notably increased their net sell bias.
U.S. equity index futures are in clear retreat gapping lower as oil prices climb following President Trump’s announcement regarding the naval blockade of the Strait of Hormuz, and follows a week where the S&P 500 (w/w +3.5% to 6,816), Nasdaq 100 (w/w +4% to 25,116), Dow 30 (w/w +3.1% to 47,916), and Russell 2000 (w/w +4.1% to 2,630) all enjoyed sizable gains on expectations that there would be a resolution to the conflict, with the latest updates naturally hurting risk appetite. Treasury yields have moved higher across the curve following the headlines, and market pricing (CME’s FedWatch) expects a hold out of the Fed this year on rates with minority likelihoods of a reduction dwindling further.
And despite higher oil prices with WTI briefly reaching $99 following a weekend escalation in U.S.–Iran tensions as Washington moves to implement a naval blockade of ships entering or leaving Iranian ports after failed peace talks, the losses on the equities front since the start of the conflict have been limited. The Dow 30 is off February’s close by about 2%, as market participants remain relatively optimistic.
Economic data released last Friday showed March CPI (Consumer Price Index) experience a significant jump in the headline figures but matched forecasts with the y/y (year-on-year) print at 3.3% from 2.4% prior and m/m (month-on-month) at 0.9%, and a slight positive was core CPI lighter than anticipated rising a notch to 2.6% with m/m growth still at 0.2%. Inflation is moving in the wrong direction, but the hope is that the initial shock stays generally contained in the shorter term. The data wasn’t pretty for the latest figures out of UoM (University of Michigan): preliminary consumer sentiment for April dropping to 47.6 well below expectations and a record low, with inflation expectations surging for the one-year print to 4.8% from 3.8% with a higher reading for the five-year as well at 3.4% from 3.2%.
We did hear from the Federal Reserve’s Daly that the economy is fundamentally solid, but an oil shock would mean that getting inflation down would take longer, and that should oil prices come back down then a rate cut wouldn’t be out of the question.
Week ahead
As for the week ahead, it’s a light start in terms of economic data with existing home sales later today before we get more pricing data with PPI (Producer Price Index) tomorrow and trade pricing on Wednesday with the usual weekly claims on Thursday. We’ll hear from plenty of FOMC (Federal Open Market Committee) members throughout the week. The interesting part will be on the earnings front, with Goldman Sachs today, JPMorgan, Citi, Wells Fargo and J&J tomorrow, Bank of America and Morgan Stanley on Wednesday, Netflix and PepsiCo on Thursday, and State Street on Friday.
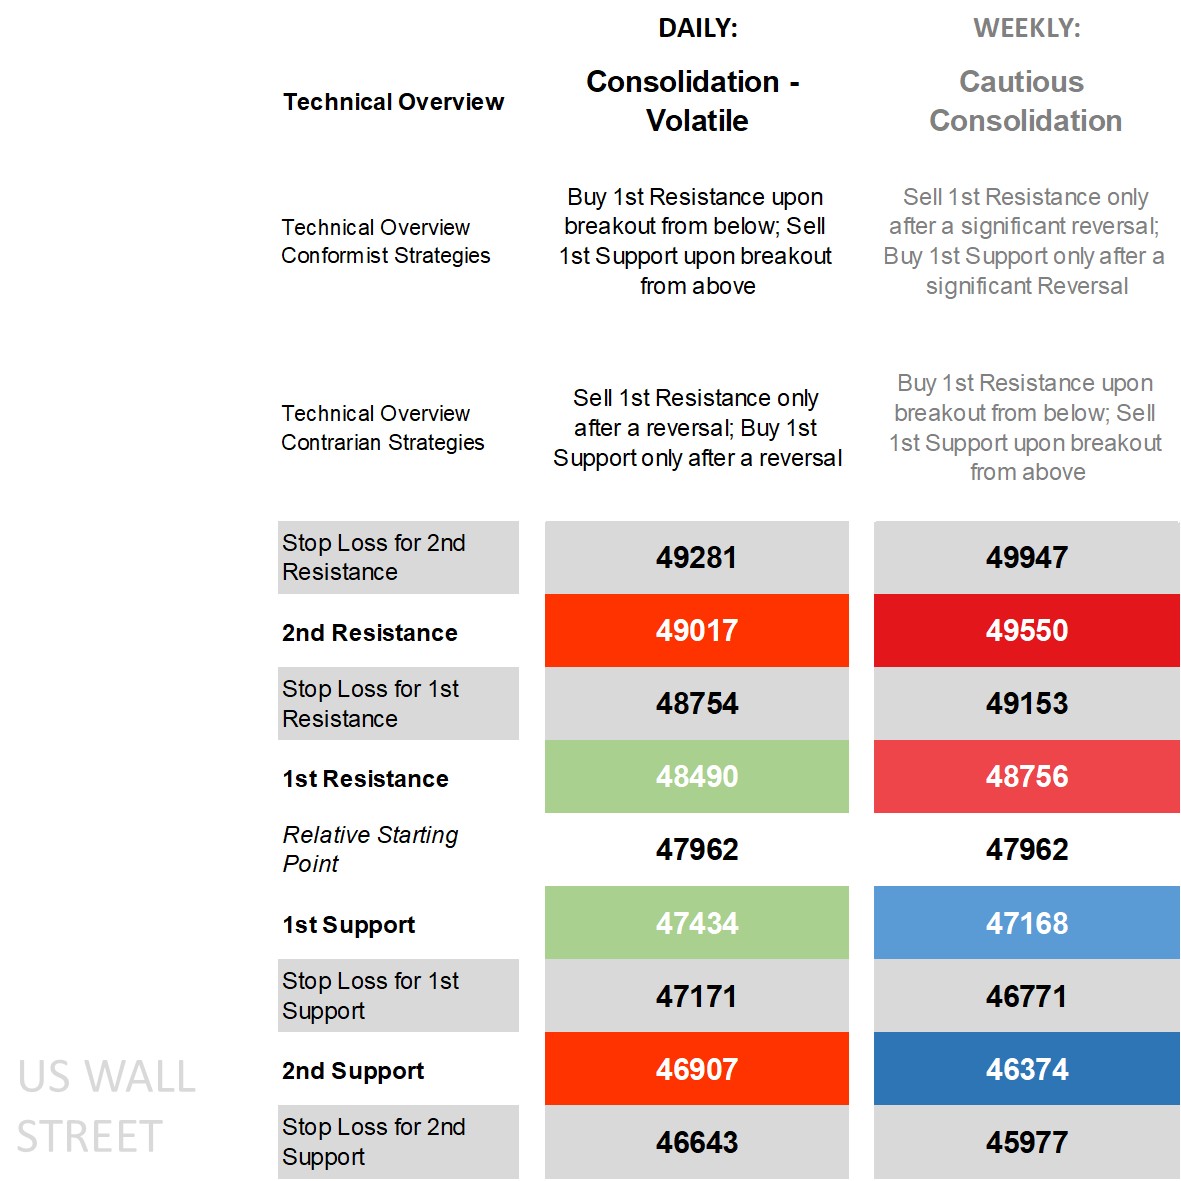
Dow 30’s technical overview, strategies and levels
Looking at the daily time frame and price is above its main short-term moving averages (MA) but mixed when it comes to the more important long-term ones crossing back above two of them as of this morning, on the DMI (Directional Movement Index) front the +DI over the -DI though yet to label it as ‘positive’ by one calculation, an RSI (Relative Strength Index) above the middle but far off overbought levels, and an ADX (Average Directional Movement Index) still in non-trending territory. The weekly time frame has mostly neutral technical indicators with price back near the middle of the Bollinger Bands after reaching the lower end of it in March.
The technical overview remains ‘consolidation – volatile’ on the daily time frame exposed to updates on the geopolitical front that are still capable of making price go beyond short-term intraday levels and causing technicals to be briefly shelved resulting in moves that while intraday may not go beyond the 1st levels every time, have a tendency to do so interday. Zooming out to the weekly and it’ll require more to go beyond longer-term price levels, and as a result the technical overview remains ‘cautious consolidation’ putting significant reversal strategies in the conformist camp and breakouts for contrarians. Opposite strategies for different time frames aren’t always ideal, but is reserved for cases where daily moves are sizable but not enough to upside weekly limits.
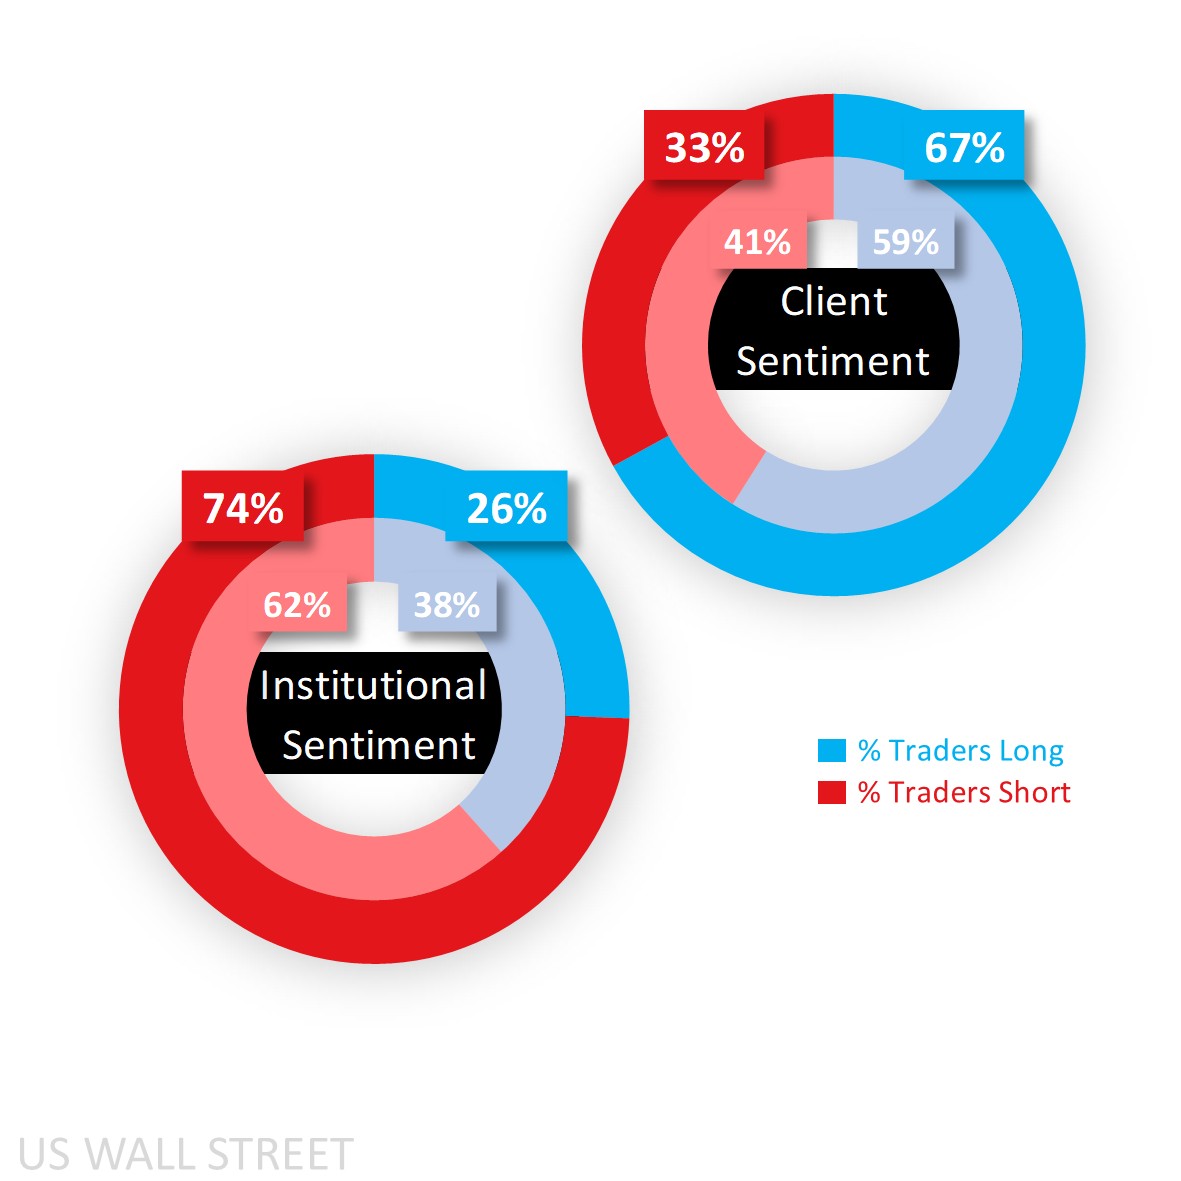
Capital.com’s client sentiment for Dow 30
Client sentiment has increased notably since the start of last week, rising from a majority long 59% to a heavy 67% as longs climbed back in on the lift off the lows while shorts have been hesitating to initiate due to the significant recovery even if incomplete.
For larger speculators according to the latest CoT (Commitment of Traders) report, they’re an opposite net sell and have raised it sizably from 62% to a heavy 74% that isn’t far off extreme short territory, and due to a reduction in longs (1,815 lots) and a simultaneous increase in shorts (3,653). For the other key equity indices, they held in net short in the S&P (54%) and trimmed it a notch in the Russell (55%), while reduced their net long sentiment in the Nasdaq (from 57% to 54%).
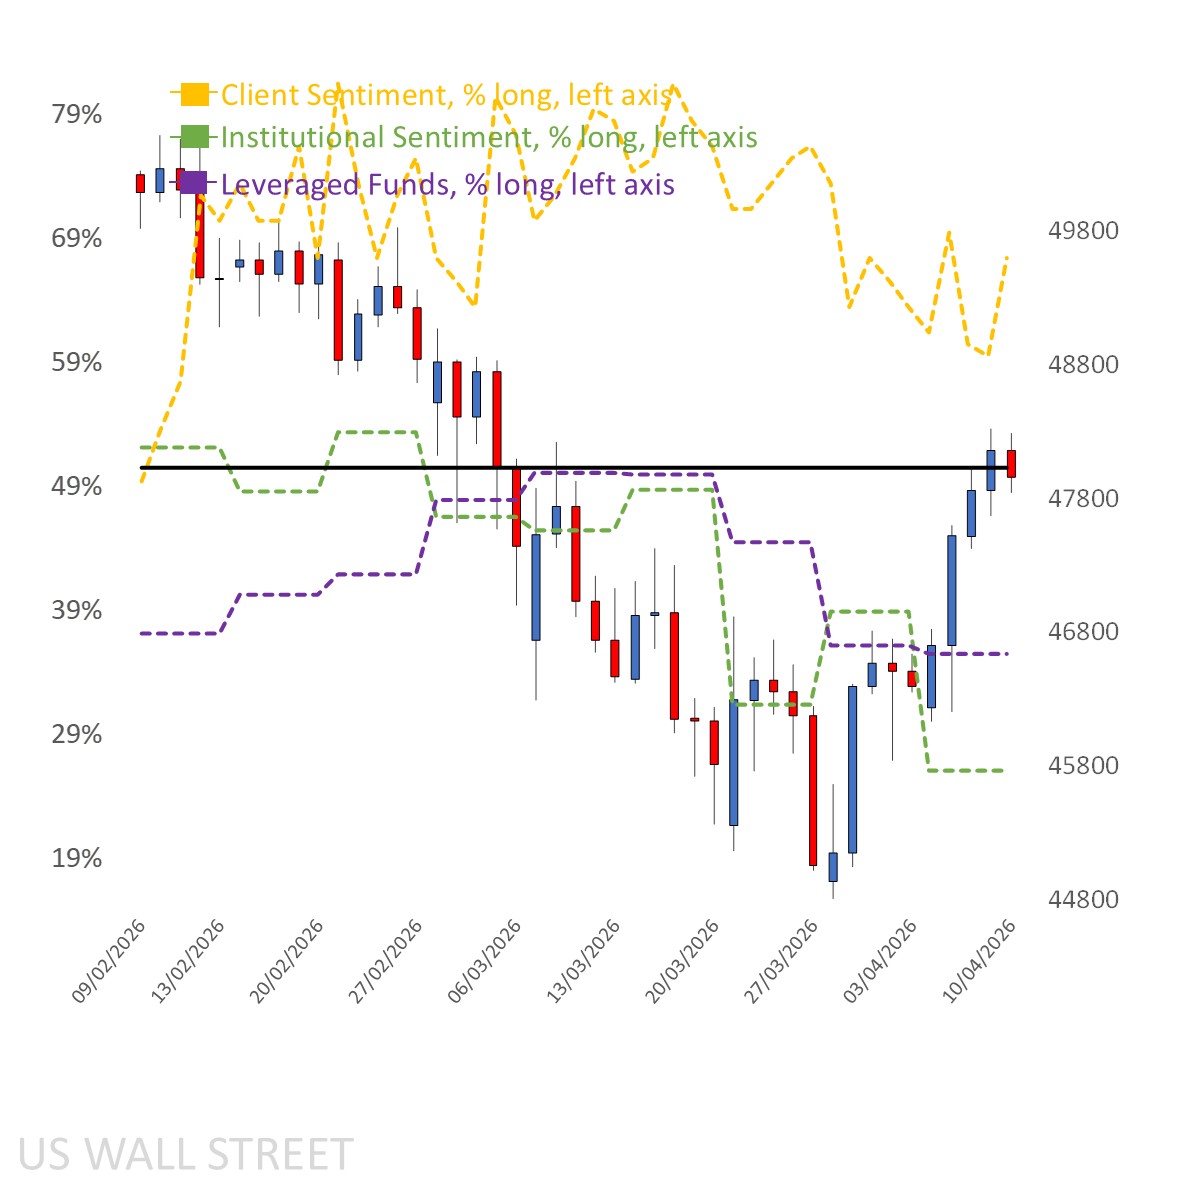
Client sentiment mapped on the daily chart
 Source: Capital.com
Period: February 2026 – April 2026
Past performance is not an indicator of future results.
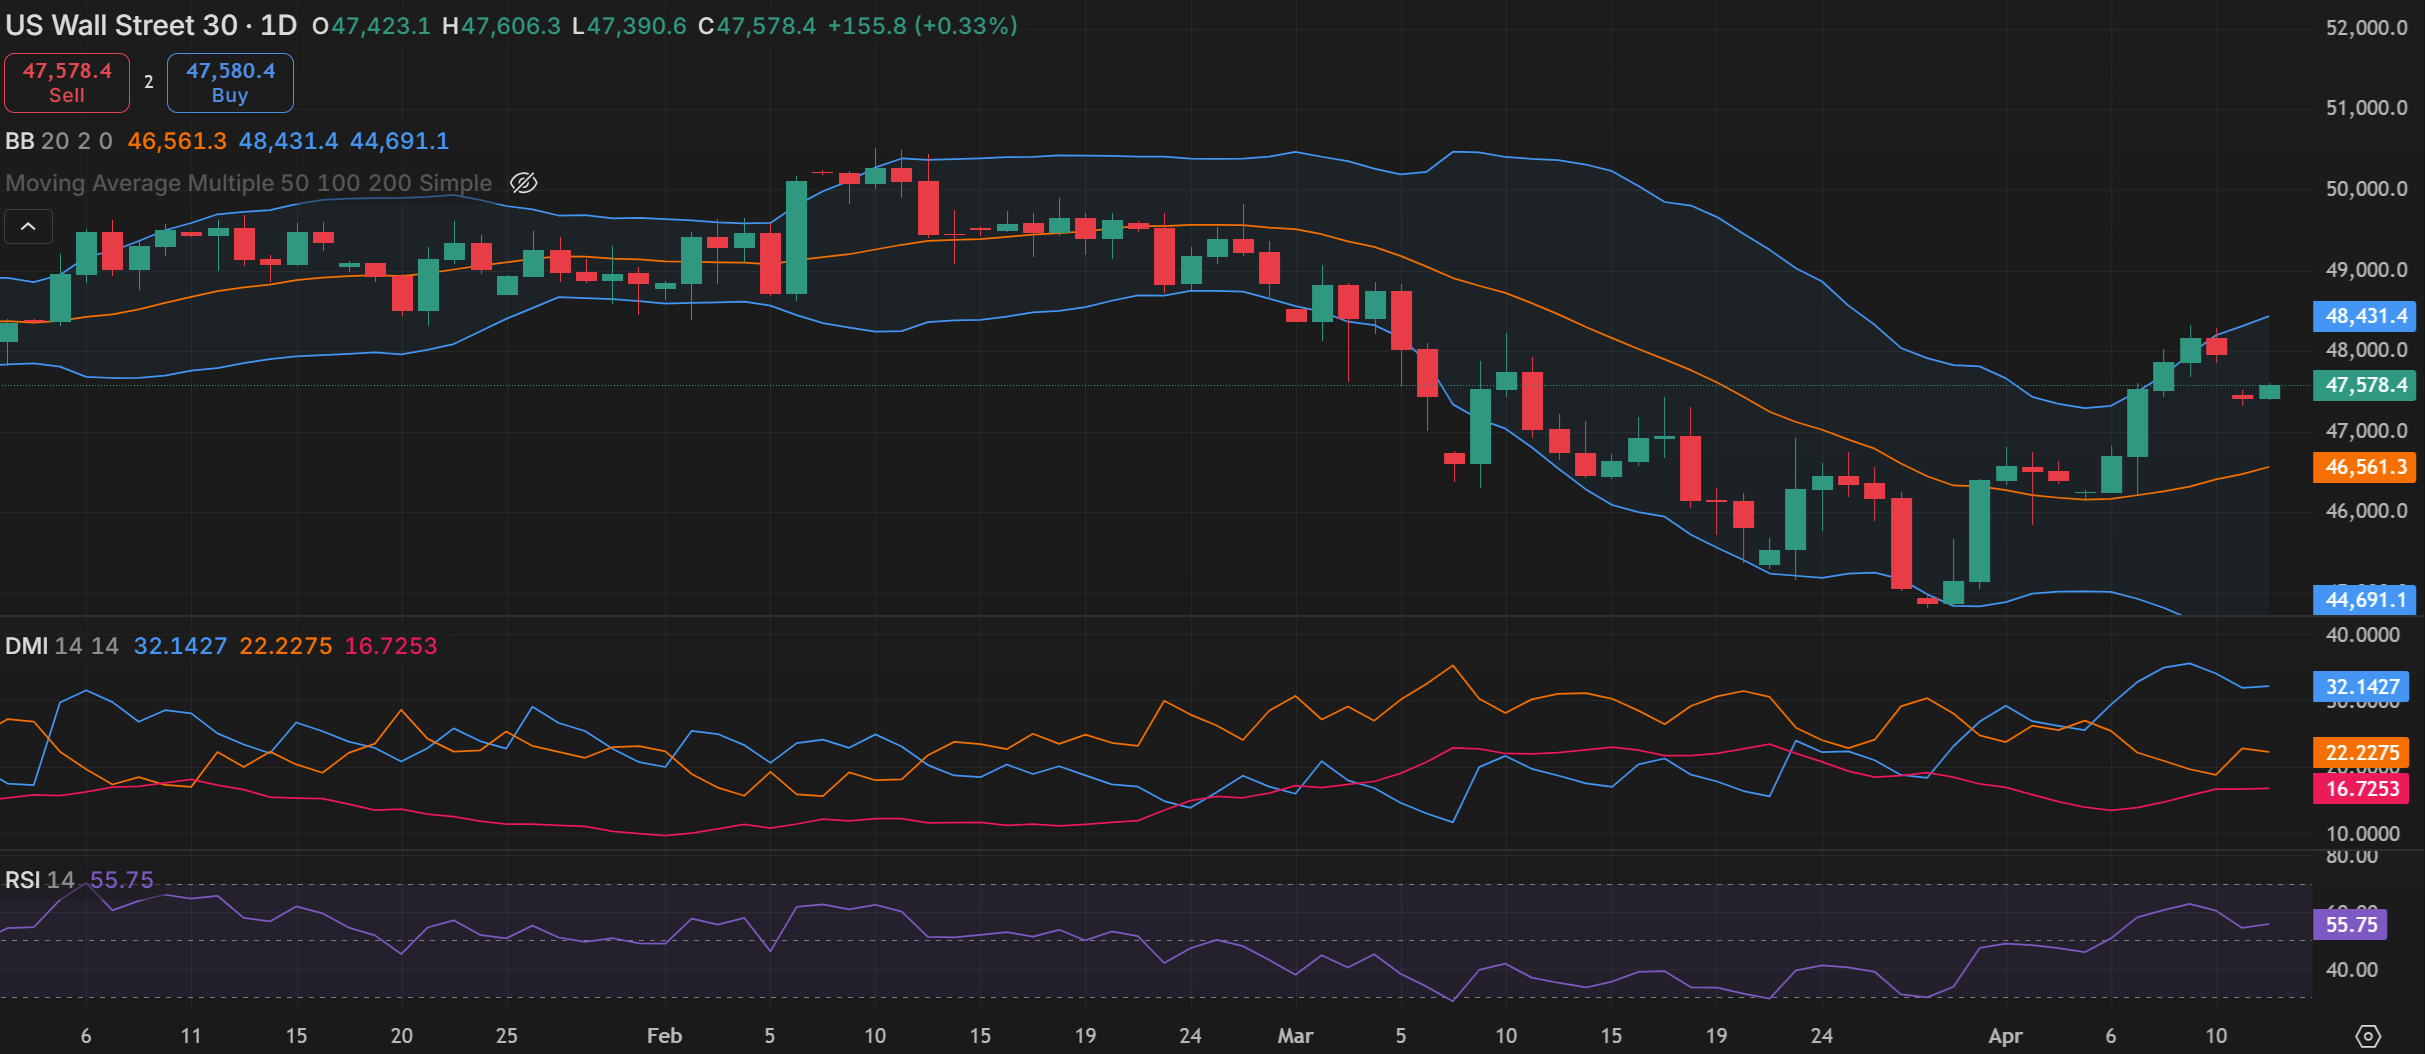
Dow 30’s chart on Capital.com’s platform with key technical indicators
Source: Capital.com
Period: January 2026 – April 2026
Past performance is not an indicator of future results