US30 forecast
US Wall Street 30 tracks 30 major US companies and remains sensitive to oil prices, US economic data, Federal Reserve expectations, and geopolitical developments, including the US-Iran conflict. Past performance is not a reliable indicator of future results. Explore third-party US30 targets.
The Dow Jones Industrial Average index – referred to as the US Wall Street 30 (US30) on CFD trading platforms such as Capital.com – is trading at $46,453.6 as of 12:54pm UTC on 7 April 2026. Past performance is not a reliable indicator of future results.
Sentiment on US equities remains under pressure from several converging factors. The ongoing US-Iran conflict has kept Brent crude elevated well above $100 per barrel, with Strait of Hormuz disruptions sustaining energy-driven inflation concerns – Brent climbed from around $71 per barrel on 27 February 2026 to $104 by 9 March 2026, according to the US Energy Information Administration (Anadolu Agency, 11 March 2026). The Wall Street rebound noted in early April – following the DJIA's 2.5% gain, or 1,125.37 points, on 1 April 2026 – has so far appeared tentative, as investors weighed geopolitical risk against hopes for an end to the Iran conflict (Yahoo Finance, 1 April 2026). The ISM Services PMI for March 2026 fell to 54 from 56.1 in February, missing the consensus forecast of 55 and signalling a moderation in services-sector expansion that added to caution around inflationary pressures (Trading Economics, 4 April 2026).
US Wall Street 30 forecast 2026–2030: Third-party targets
As of 2 April 2026, third-party US Wall Street 30 predictions span a wide range, shaped by Federal Reserve policy expectations, geopolitical risk from the US-Iran conflict, energy price volatility, and corporate earnings trajectories. The following targets summarise leading projections for the DJIA published between 25 March and 7 April 2026.
Long Forecast (monthly cycle model)
Long Forecast puts the DJIA's April 2026 close at $41,318, within a month range of $38,412–$48,000, after opening the period near $45,267; December 2026 closes at $47,000, within a $43,710–$50,290 band. The model applies long-term price-cycle extrapolation and conditions this path on a near-term pullback through mid-year before a gradual recovery, with ongoing geopolitical and energy-cost pressures cited as the primary drag through Q2 (Long Forecast, 30 March 2026).
LiteFinance (technical analysis model)
LiteFinance projects an April 2026 average near $44,817, within a $43,700–$45,934 range, recovering toward a December average of $52,126, within a $50,654–$53,598 band. The model derives its bearish near-term path from a Rising Wedge breakdown on the weekly chart at $48,434, with declining MACD and RSI readings at 37 signalling continuing downward momentum, while noting geopolitical and energy-sector uncertainty as amplifying factors (LiteFinance, 1 April 2026).
Motley Fool (macro outlook)
The Motley Fool notes that historical data covering 1950 to 2025 show April ranks as the best month for the Dow Jones on average, gaining around 1.9%, amid expectations that sentiment may stabilise after Q1's geopolitically driven sell-off. The piece notes that DJIA constituent earnings resilience and a potential de-escalation in Middle East tensions are cited as conditions for any recovery, while cautioning that current macro headwinds remain elevated (Motley Fool, 1 April 2026).
Coin Price Forecast (stepwise extrapolation)
Coin Price Forecast estimates the DJIA will reach approximately $54,082 at mid-year 2026 and close the year at $54,651, representing a year-on-year gain of roughly 14% from the 2026 opening level of $48,063. The model applies a stepwise linear extrapolation from historical price series and conditions its path on stable monetary policy and continued earnings growth, noting that the year-end target has been trimmed from earlier iterations above $56,000 as recent weakness has been incorporated (Coin Price Forecast, 7 April 2026).
Predictions and third-party forecasts are inherently uncertain, as they cannot fully account for unexpected market developments. Past performance is not a reliable indicator of future results.
US30 index price: Technical overview
The US30 index trades at $46,453.6 as of 12:54pm UTC on 7 April 2026, sitting just above the 20-day SMA at $46,452 and broadly in line with the 200-day SMA at $46,739. The shorter moving averages – the 10- and 20-day SMAs at $46,118 and $46,452 – are signalling a buy, while the 30-, 50-, and 100-day SMAs at $47,219, $48,117, and $48,104 all sit above the current price and register sell signals, indicating that the index remains below its medium-term moving-average cluster (TradingView, 7 April 2026).
The 14-day relative strength index reads 47.28, a neutral reading that places momentum in the middle of its range without indicating either overbought or oversold conditions. The average directional index at 32.99 suggests that an established trend is in place, according to TradingView's oscillator data.
On the classic pivot framework, the pivot point at $46,821 is the nearest reference above the current price; a daily close above that level would put R1 at $48,585 in view. To the downside, S1 at $44,577 is the next reference below the pivot, with the 100-day SMA level at $48,104 and 200-day SMA at $46,739 framing the broader range (TradingView, 2 April 2026).
This is technical analysis for informational purposes only and does not constitute financial advice or a recommendation to buy or sell any instrument.
US Wall Street 30 index history (2024–2026)
The Dow Jones Industrial Average (DJIA), tracked here as the US Wall Street 30 (US30), ended 2024 at $42,509.0 before climbing steadily through 2025 to close the year at $48,066.5 – a gain of 13.1% across the calendar year.
The US Wall Street 30 index opened 2026 near $48,128.9 and extended that run into mid-February, reaching an intraday peak of $50,519.0 on 10 February 2026 – the highest level in the dataset. That advance was short-lived; escalating geopolitical tensions linked to the US-Iran conflict, rising energy costs, and broader risk-off sentiment weighed on markets through March and into April, pulling the index back below $47,000.
US30 closed at $46,454.3 on 7 April 2026, which is approximately 3.5% down year to date, but 20.8% up year on year – the comparable close on 7 April 2025 sat near $38,457.3, a level reached during the sharp tariff-driven sell-off that saw the index touch an intraday low of $36,608.5 on that same date.
Past performance is not a reliable indicator of future results. Share prices are indicative and may differ from live market prices.
US Wall Street 30 (US30): Capital.com analyst view
US Wall Street 30's price action over the past two years reflects the competing forces that define large-cap US equity markets. The index climbed from the high-$30,000s in early 2024 to an intraday peak above $50,500 in February 2026, driven by resilient corporate earnings, Federal Reserve rate expectations, and optimism around AI-linked productivity gains among Dow constituents. That advance, however, came alongside persistent inflation, trade-policy uncertainty following the Trump administration's tariff agenda, and geopolitical pressure from the US-Iran conflict, all of which contributed to the index's retreat towards current levels near $46,454.3.
On one hand, a de-escalation in Middle East tensions, stabilising energy prices, or a clearer Federal Reserve rate path could support a recovery in risk appetite and lift the index back towards its recent highs. On the other hand, sustained oil price strength, further tariff disruptions to global supply chains, or a reassessment of stretched equity valuations – with the DJIA still roughly 9% above its end-2024 close – could extend the current pullback. The index's concentration in large, cash-generative businesses provides a degree of earnings stability, but that same profile means it may respond sharply to any deterioration in the macroeconomic or geopolitical backdrop.
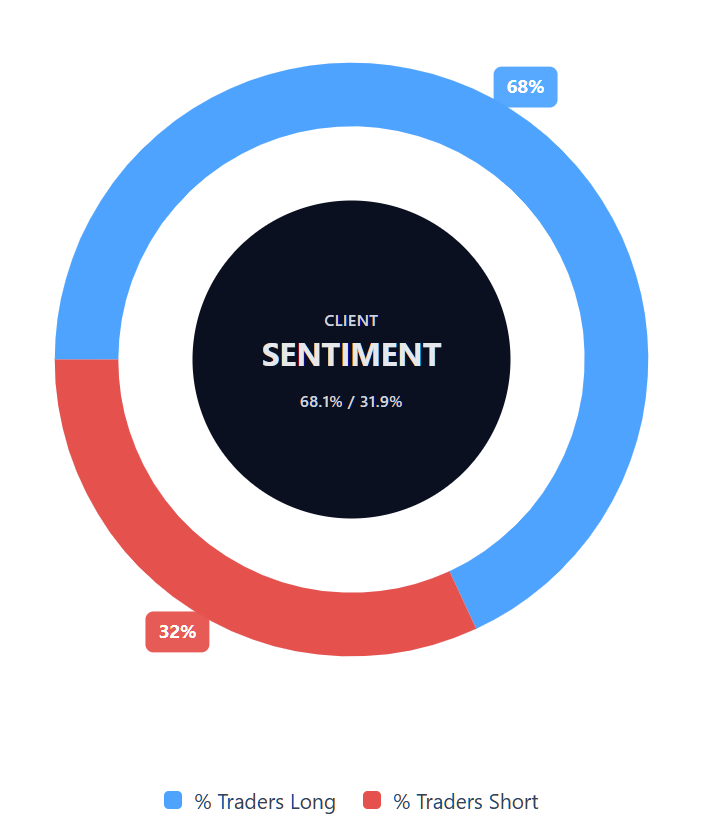
Capital.com’s client sentiment for US Wall Street 30 CFDs
As of 2 April 2026, Capital.com client positioning in US Wall Street 30 CFDs shows 68.1% buyers versus 31.9% sellers, leaving buyers ahead by 36.2 percentage points and keeping sentiment in majority-buy territory, though still short of an extreme. This snapshot reflects open positions on Capital.com and can change.
Summary – US Wall Street 30 2026
- US30 trades at $46,453.6 as of 12:54pm UTC on 7 April 2026, down 3.5% year to date from the January 2026 open near $48,128.9, but 20.8% above the same date last year.
- TradingView’s technical indicators are mixed: short-term SMAs (10/20-day) signal a buy, while the 30-, 50-, and 100-day SMAs all sit above the current price and register sell signals, with the 14-day RSI neutral at 47.28.
- Key drivers include the US-Iran conflict keeping energy costs elevated, Federal Reserve rate expectations, ongoing tariff-policy uncertainty, and corporate earnings resilience among Dow constituents.
Past performance is not a reliable indicator of future results.
FAQ
What is the 5 year US Wall Street 30 forecast?
Is US Wall Street 30 a good CFD to trade?
Could US Wall Street 30 go up or down?
Should I invest in US Wall Street 30?
Can I trade US Wall Street 30 CFDs on Capital.com?
Yes, you can trade US Wall Street 30 CFDs on Capital.com. Trading index CFDs lets you speculate on price movements without owning the underlying asset and to take long or short positions. However, contracts for difference (CFDs) are traded on margin, and leverage amplifies both profits and losses. You should ensure you understand how CFD trading works, assess your risk tolerance, and recognise that losses can occur quickly.