US Tech 100 forecast: Nvidia jump, yields ease
US Tech 100 steadied after a sharp rebound in US equities on 1 April, with Nvidia rising 5.6% as easing Treasury yields and lower geopolitical risk supported sentiment. Past performance is not a reliable indicator of future results. Explore third-party US100 price targets and technical analysis.
The Nasdaq 100 index – referred to as the US Tech 100 (US100) on CFD trading platforms such as Capital.com – is trading at $24,102.8 as of 4:50pm UTC on 1 April 2026. Past performance is not a reliable indicator of future results.
Sentiment improved on 1 April as US stocks rebounded sharply, with the Nasdaq gaining 3.8% in the prior session, after President Trump indicated a Middle East deal could be close and signalled a potential US withdrawal from the Iran conflict within two to three weeks, reducing energy-supply risk and lifting technology and communication services stocks. Nvidia advanced 5.6% and Marvell rose 12.8% in the session. US 10-year Treasury yields eased to around 4.285% from a 4.48% peak last week as traders rebuilt Federal Reserve rate-cut expectations, reducing the discount-rate pressure that had weighed on growth-oriented technology names. The VIX closed at 25.25 on 31 March, down 17.5% on the day but still elevated, reflecting ongoing uncertainty around oil prices, geopolitics, and upcoming US macro releases, including ISM Manufacturing and ADP Employment data due on 1 April (Saxo Bank, 1 April 2026).
US Tech 100 forecast 2026–2030: Third-party targets
As of 1 April 2026, third-party US Tech 100 predictions reflect a cautious near-term outlook, shaped by elevated US 10-year Treasury yields, ongoing Middle East conflict, and the index's sharp retreat from its late-January peak of approximately 26,280.
Wallet Investor (daily technical model)
Wallet Investor logged daily Nasdaq 100 Futures prices of 24,525, narrowing to 24,382 on 23 March and 24,471 on 24 March, within projected daily ranges of roughly 24,200–24,865, before the index subsequently broke lower into the 22,800–23,100 zone by month-end. The service's automated technical model also projected an April 2026 monthly close of approximately 25,617, within an April range of 25,370–25,617, as the model captured conditions prior to the late-March sell-off (Wallet Investor, 25 March 2026).
Daily Forex (short-term technical outlook)
Daily Forex notes current resistance at 23,250 and current support at 23,100, with a near-term high target of 23,575 and a low target of 22,775, as futures traded around 23,135 on the morning of 31 March 2026. Analyst Robert Petrucci identifies the prior session's low of approximately 22,800, a level last seen in early August 2025, as a key reference, noting that the index declined from a late-January high near 26,280 amid persistent selling driven by the Iranian conflict and rising Treasury yields (Daily Forex, 31 March 2026).
Long Forecast (monthly algorithmic model)
Long Forecast projects the Nasdaq 100 to open April 2026 near 23,742 and close the month at approximately 23,298, reflecting an estimated monthly decline of 1.9% within a projected April range of 21,492–25,690. The model's March 2026 estimate had placed the month-end close at 23,742, a change of 4.9% lower, consistent with the actual retreat observed across the month (Long Forecast, 1 April 2026).
30rates.com (statistical monthly model)
30rates.com projects the Nasdaq 100 to average approximately 23,046 in April 2026 and close the month near 23,114, a change of +1.2% from its projected April opening level of 22,841, within a range of 21,496–24,732. The service's statistical model derives monthly projections from historical volatility and trend patterns, without incorporating fundamental inputs (30rates.com, 1 April 2026).
Predictions and third-party forecasts are inherently uncertain, as they cannot fully account for unexpected market developments. Past performance is not a reliable indicator of future results.
US100 index price: Technical overview
The US100 index trades at $24,102.8 as of 4:50pm UTC on 1 April 2026, sitting below a dense moving-average shelf where the 20/50/100/200-day SMAs stack between roughly 24,271 / 24,816 / 25,062 / 24,437, with all four registering sell signals on TradingView's indicator summary. The short-term 10-day SMA at 23,809 and the Hull moving average (9) at 23,345 are the only moving-average readings currently aligned with the buy side, reflecting the index's proximity to near-term lows rather than a broader trend recovery.
Momentum indicators are broadly mixed. The 14-day RSI sits at 47.05, a neutral reading that places the index in the middle of its oscillator range with no clear directional bias, while the ADX (14) at 34.40 indicates that an established trend is in force, according to TradingView data. The MACD (12, 26) registers a sell signal at -365.97, consistent with the broader negative cross visible in the moving-average structure.
On classic pivot levels, the pivot point at 23,924 represents the nearest reference below the current price; a slip beneath it would bring S1 at 22,658 into view as the next structured support. To the upside, R1 at 25,006 is the immediate overhead reference, with R2 at 26,271 marking a secondary area that a daily close above R1 would put back in focus (TradingView, 1 April 2026).
This is technical analysis for informational purposes only and does not constitute financial advice or a recommendation to buy or sell any instrument.
US Tech 100 index history (2024–2026)
The US Tech 100 (US100) tracks the Nasdaq 100 index, a basket of the 100 largest non-financial companies listed on the Nasdaq Stock Market, weighted by market capitalisation.
The US Tech 100 index opened April 2024 near 18,258 and traded broadly sideways through mid-year, reaching a short-term high of 20,760 on 11 July 2024 before a sharp summer pullback dragged it down to an intraday low of 17,244 on 5 August 2024 amid a global risk-off episode. A recovery followed through the autumn, with the index closing 2024 at 21,015, up roughly 15% on the year from its 2 April 2024 open.
2025 opened near 21,048 and the index ground higher into late January, tagging 21,875 on 23 January before a heavy sell-off on 27 January pulled it back sharply. A volatile first quarter gave way to a significant breakdown in April 2025: the index plunged to an intraday low of 16,343 on 7 April amid broad market stress, before staging a recovery to close the year around 25,222 on 31 December 2025.
2026 began near 25,287 and the index extended to a year-to-date high of 26,219 on 28 January before reversing. By late March 2026, sustained selling had pushed it back below 23,000, with an intraday low of 22,781 recorded on 31 March. US100 closed at 24,108.8 on 1 April 2026, approximately 4.7% down year to date.
Past performance is not a reliable indicator of future results. Share prices are indicative and may differ from live market prices.
US Tech 100 (US100): Capital.com analyst view
The US Tech 100's performance in 2026 has been marked by a sharp divergence between a strong opening and a painful first-quarter retreat. The index extended its multi-year advance to a year-to-date high near 26,219 in late January, supported by sustained AI capital expenditure across cloud, semiconductor, and data centre sectors, as well as expectations for further Federal Reserve rate reductions, which tend to compress discount rates and lift the valuations of long-duration growth stocks. However, the picture carries meaningful downside risks. Broader uncertainty around US trade policy, including new tariff measures, has weighed on technology supply chains and dampened risk appetite, while questions about the return on AI infrastructure investment have introduced a layer of caution that had not been present in 2024.
By late March 2026, the index had given back a substantial portion of its January gains, closing 31 March near 23,856, with elevated US Treasury yields acting as a persistent headwind for growth-oriented equities. A recovery into the 24,100 area on 1 April suggests some stabilisation, though the index remains notably below its 2026 highs. Bulls point to resilient technology earnings and the potential for AI-driven revenue to broaden beyond mega-cap names, while bears note that trade policy uncertainty and still-elevated yields could limit the pace of any recovery.
Capital.com’s client sentiment for US Tech 100 CFDs
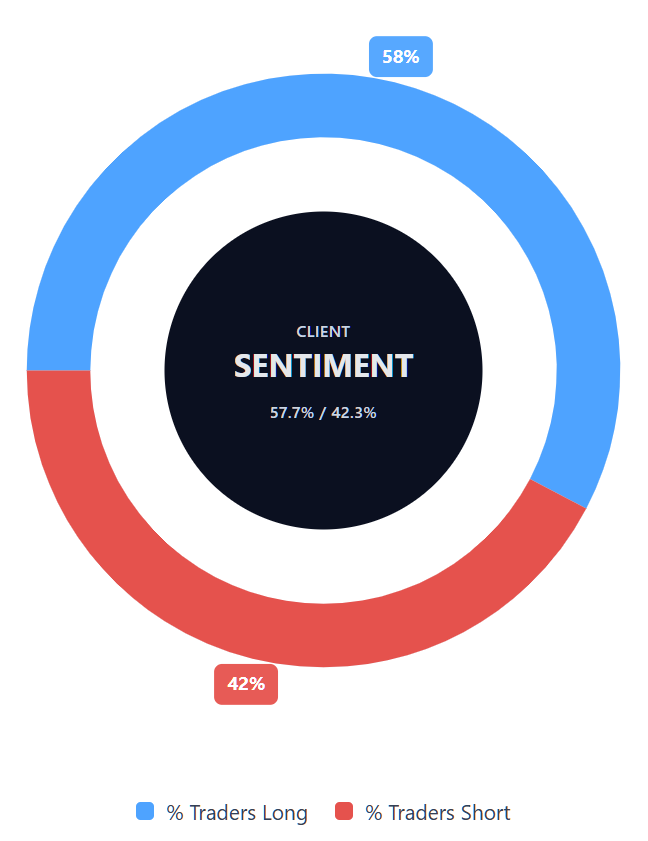
As of 1 April 2026, Capital.com client positioning in US Tech 100 CFDs shows buyers at 57.7% against sellers at 42.3%. This places the index in slight long-bias territory without approaching an extreme skew. This snapshot reflects open positions on Capital.com and can change rapidly as market conditions evolve.
Summary – US Tech 100 2026
- US100 trades at $24,102.8 as of 4:50pm UTC on 1 April 2026, down roughly 4.7% year to date from the 1 January 2026 open at $25,287.
- The late-March sell-off was driven by Middle East geopolitical tensions and persistent yield pressure, with the index briefly touching $22,781 on 31 March before recovering.
- Key drivers include sustained AI capital expenditure and Federal Reserve rate-cut expectations. Risks include elevated US Treasury yields and trade policy uncertainty, which continue to weigh on technology valuations.
Past performance is not a reliable indicator of future results.
FAQ
What is the 5 year US Tech 100 forecast?
A five-year US Tech 100 forecast is inherently uncertain because the index can respond to changes in interest rates, technology earnings, regulation, trade policy and broader risk appetite over time. Long-term projections may offer a useful framework, but they rely on assumptions that can change. That means traders often treat five-year forecasts as one input among many, rather than as a precise guide to where the index will trade in future.
Is US Tech 100 a good CFD to trade?
Whether US Tech 100 is a good CFD to trade depends on your objectives, time horizon, risk tolerance and understanding of leveraged products. The index is widely followed, highly liquid and often active around earnings, macro data and rate expectations, which may appeal to some traders. At the same time, that volatility can increase risk, especially when using leverage. As with any CFD market, it’s important to weigh potential opportunities against the possibility of losses.
Could US Tech 100 go up or down?
Yes, the US Tech 100 could move in either direction, and the article shows that both upside and downside drivers remain in play. Supportive factors include easing Treasury yields, resilient technology earnings and continued AI-related spending. On the other hand, elevated yields, geopolitical developments and uncertainty around trade policy could continue to pressure sentiment. Because several variables are influencing the index at once, short-term direction remains uncertain rather than one-sided.
Should I invest in US Tech 100?
Whether you should invest in US Tech 100 is a personal decision and not something this article can answer for you. The piece is designed to explain market context and summarise third-party forecasts, not to provide investment advice or a recommendation. If you are considering exposure, it may help to assess your goals, experience, financial situation and appetite for risk first. You should also remember that past performance is not a reliable indicator of future results.
Can I trade US Tech 100 CFDs on Capital.com?
Trading US Tech 100 CFDs on Capital.com lets you speculate on movements without owning the underlying asset and to take long or short positions. However, contracts for difference (CFDs) are traded on margin, and leverage amplifies both profits and losses. You should ensure you understand how CFD trading works, assess your risk tolerance, and recognise that losses can occur quickly.