DAX forecast: US tariff plans, EU response risk
Germany 40 is a benchmark index of major German-listed companies, with sentiment in early April 2026 shaped by US tariff plans and the risk of EU countermeasures. Past performance is not a reliable indicator of future results. Explore third-party DE40 targets and technical analysis.
The DAX index – referred to as the Germany 40 (DE40) on CFD trading platforms such as Capital.com – is trading at €22,937.3 in early European trading at 10:08am UTC on 2 April 2026, having moved within an intraday range of €22,835.9–€23,376.1. Past performance is not a reliable indicator of future results.
The session reflects a risk-off tone across European equities as investors brace for a scheduled US tariff announcement later that day. US trade policy has weighed on the index since mid-January, when Trump's tariff threats against European goods rattled sentiment, while the EU has been assessing retaliatory measures on approximately €93 billion of US imports (Reuters, 23 January 2026). The ECB's March 2026 staff projections noted that the revised US effective tariff rate on euro area imports was 10.5%, flagging tariff changes as a material variable in its euro area growth outlook (ECB, 18 March 2026).
Germany 40 forecast 2026–2030: Third-party targets
As of 2 April 2026, third-party Germany 40 predictions reflect a wide spread of near-term and year-end projections, shaped by the trajectory of US tariff escalation, ECB rate expectations, Germany's fragile industrial recovery, and elevated energy costs tied to Middle East conflict.
RoboForex (technical and fundamental, near-term)
RoboForex sets a near-term pessimistic scenario target of €21,145 for the DE40 if it confirms a break below the support level at €22,080, while citing €23,840 as the upside scenario should prices clear resistance at €23,090. The service notes that Germany's February Producer Price Index came in at −0.5% month on month, against a consensus forecast of +0.3%, a reading it describes as a 'moderately positive signal' for inflation expectations but insufficient to reverse the index's bearish momentum amid doubts over the strength of the German economy (RoboForex, 30 March 2026).
Trading Economics (macro model, quarterly)
Trading Economics models the DE40 ending Q2 2026 at approximately €21,018, with its 12-month macro regression placing the index near €19,808. The platform derives these figures from global macro indicators and analyst survey inputs, noting that the index recorded a loss of approximately 10% over the preceding month – its steepest monthly decline since March 2020 – amid US tariff pressures and elevated energy costs (Trading Economics, 31 March 2026).
Long Forecast (range-based monthly path)
Long Forecast projects the DE40 opening April 2026 at €22,301, with a monthly range of €18,288–€23,862 and a month-end close of approximately €19,664, representing a projected change of −11.8% for the month. The service derives its month-by-month bands from extrapolated historical price behaviour with sensitivity to interest-rate expectations and geopolitical developments, and updates its projections on a rolling daily basis (Long Forecast, 2 April 2026).
Coin Price Forecast (algorithmic, year-end 2026 target)
Coin Price Forecast sets a year-end 2026 target of €24,662 for the DE40, with a mid-2026 level of €23,888. The model extrapolates from historical price momentum under the assumption of no structural shift in monetary conditions (Coin Price Forecast, 2 April 2026).
Predictions and third-party forecasts are inherently uncertain, as they cannot fully account for unexpected market developments. Past performance is not a reliable indicator of future results.
DE40 index price: Technical overview
On the daily chart for 2 April 2026 at 10:08am UTC, the DE40 index trades at €22,937.3, sitting below its 20/50/100/200-day simple moving averages at approximately €23,114 / €24,125 / €24,181 / €24,098, with price currently beneath all four levels – a bearish stack alignment per TradingView's moving average readings. The 10-day SMA at €22,701 and 10-day EMA at €22,896 are the only moving average signals registering a buy reading, reflecting the very near-term bounce from session lows rather than a broader trend shift.
Momentum is mixed to subdued: the 14-day RSI sits at 44.15, a neutral reading consistent with neither oversold conditions nor recovering momentum, while the average directional index (14) reads 31.95, indicating an established , if currently bearish, trend in progress. The MACD level (12, 26) at −410.61 registers a buy signal, suggesting the rate of decline may be moderating, though bull bear power at −23.21 holds a sell reading. The Hull moving average (9) at €22,976 also registers a sell signal.
On the upside, the classic R1 pivot at €24,431 represents the nearest overhead reference; a daily close above that level would put R2 near €26,181 back in view. On the downside, the classic pivot point at €23,147 sits marginally above the last price and acts as the initial reference, with S1 at €21,397 the next meaningful support zone should current levels give way (TradingView, 2 April 2026).
This is technical analysis for informational purposes only and does not constitute financial advice or a recommendation to buy or sell any instrument.
Germany 40 index history (2024–2026)
The Germany 40 index closed 2024 at approximately €19,832, capping a year of steady recovery for German equities, and carried that momentum into 2025, closing the year at €24,502, a gain of around 23.5% over the twelve months.
2025 began around €19,848 before the index pushed steadily higher through the first quarter. That advance was abruptly tested in early April, when the announcement of broad US reciprocal tariffs drove the index to an intraday low of €18,809 on 7 April 2025 – its sharpest single-week drop in years. The index recovered through the summer, reclaiming the €24,000 area by autumn and holding within a tight range through November and December.
2026 opened at €24,521. The index reached its highest point of the two-year period at €25,511 on 13 January 2026, before a broad sell-off through February and March pulled prices sharply lower. A fresh round of US tariff concerns accelerated losses in late March, with the index sliding toward €21,972 on 29 March 2026 before a partial recovery.
DE40 closed at €22,939 on 2 April 2026, approximately 6.5% down year to date but 5.7% higher year on year.
Past performance is not a reliable indicator of future results. Share prices are indicative and may differ from live market prices.
Germany 40 (DE40): Capital.com analyst view
The Germany 40's performance over the past two years reflects the tension between Germany's structural economic challenges and the periodic bursts of optimism that have driven European equity re-ratings. The index surged roughly 23.5% through 2025, supported by ECB rate cuts, a resilient labour market, and strong earnings from defence and industrial heavyweights such as Rheinmetall. However, the 2026 narrative has shifted considerably, with the index down approximately 6.5% year to date as US tariff escalation weighs on Germany's export-dependent economy – the same open-trade model that amplifies gains in benign conditions also magnifies downside when trade barriers rise.
Domestically, Germany's fiscal pivot towards higher defence and infrastructure spending could provide a meaningful earnings tailwind for index constituents, and any de-escalation in US-EU trade tensions would likely be reflected quickly given the index's sensitivity to global risk appetite. On the other hand, persistently weak industrial output, elevated energy costs linked to Middle East supply uncertainty, and a stronger euro remain credible headwinds that could limit the pace of any recovery.
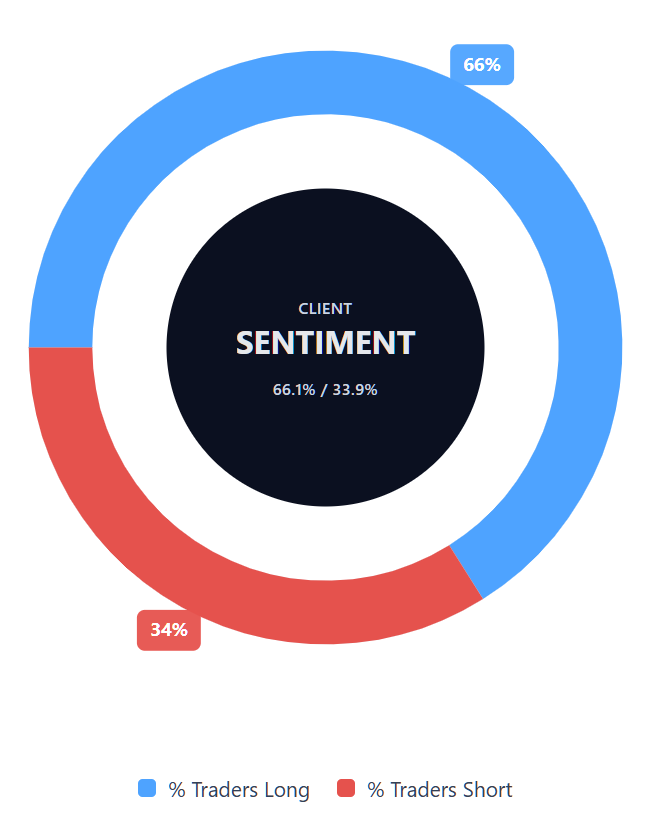
Capital.com’s client sentiment for Germany 40 CFDs
As of 2 April 2026, Capital.com client positioning in Germany 40 CFDs sits at 66.1% long vs 33.9% short, which keeps it in majority-buy territory but shy of an extreme, with buyers ahead by 32.2 percentage points. This snapshot reflects open positions on Capital.com and can change.
Summary – Germany 40 2026
- As of 10:08am UTC on 2 April 2026, the Germany 40 (DE40) trades at €22,937.3, down approximately 6.5% year to date and within a two-year range of roughly €17,000–€25,511.
- Technical indicators lean bearish: price sits below all key moving averages from the 20-day to the 200-day, with the 14-day RSI at 44.15 in neutral territory and the average directional index suggesting an established downtrend.
- Key drivers include escalating US tariff pressures on German exports, ECB monetary policy, energy costs tied to Middle East tensions, and Germany's domestic fiscal shift towards defence and infrastructure spending.
- Recent news centres on broad European equity selling ahead of President Trump's 2 April reciprocal tariff announcement, with the DAX recording its steepest monthly loss since March 2020 through late March 2026.
Past performance is not a reliable indicator of future results.
FAQ
What is the 5 year US 500 forecast?
There is no single five-year forecast for the US 500. Long-term projections vary widely because they depend on factors such as US economic growth, interest rates, inflation, corporate earnings and valuation levels. Third-party forecasts can offer a useful reference point, but they are based on assumptions that may change over time. For that reason, five-year outlooks are best viewed as scenarios rather than fixed expectations.
Is US 500 a good CFD to trade?
Whether the US 500 is a suitable CFD market depends on your objectives, risk tolerance and trading approach. It is one of the most widely followed equity indices, which means it often offers high liquidity and frequent price movement. At the same time, CFDs are leveraged products, so gains and losses can both be magnified. Traders usually consider volatility, costs, holding period and risk-management tools before trading index CFDs.
Could US 500 go up or down?
Yes. The US 500 can move in either direction, sometimes quickly, depending on macroeconomic data, central bank policy, company earnings, geopolitical events and broader market sentiment. A stronger growth outlook or easing inflation could support the index, while weaker earnings or tighter financial conditions could weigh on it. Because several drivers can act at once, short-term direction is uncertain and price moves are rarely linear.
Should I invest in US 500?
That depends on your financial goals, time horizon and tolerance for risk. More broadly, this article is for informational purposes only and does not provide investment advice. If you are considering exposure to the US 500, it is important to understand the product you are using, the risks involved and how it fits within your overall strategy. With CFDs in particular, you do not own the underlying asset and losses can exceed expectations if risk is not managed carefully.
Can I trade US 500 CFDs on Capital.com?
Yes, you can trade Germany 40 CFDs on Capital.com. Trading index CFDs lets you speculate on price movements without owning the underlying asset and to take long or short positions. However, contracts for difference (CFDs) are traded on margin, and leverage amplifies both profits and losses. You should ensure you understand how CFD trading works, assess your risk tolerance, and recognise that losses can occur quickly.