Stellantis stock forecast: Third-party price targets
Stellantis is a multinational car manufacturer listed in Milan and New York, formed from the merger of Fiat Chrysler and PSA Group, with operations spanning Europe, North America and other global markets. Explore third-party STLAM price targets and technical analysis.
Stellantis N.V. (STLAM) is trading around €6.57 in early European hours on 12 February 2026, within an intraday range of €6.20–€6.60, as quoted on Capital.com at 10:33am UTC. Past performance is not a reliable indicator of future results.
The stock remains in focus after Stellantis disclosed preliminary H2 2025 figures, including approximately €22bn in charges linked to a reset of its electrification strategy and product plans, alongside related write-downs and impairments (Reuters, 6 February 2026). These announcements followed earlier communication on a strategic shift in EV investment, indications of a projected 2025 net loss, and the suspension of the 2026 dividend (CNBC, 6 February 2026).
Stellantis stock forecast 2026–2030: Third-party price targets
As of 12 February 2026, third-party Stellantis stock predictions show a wide range of 12-month views across US- and Europe-listed lines, published around the company’s recent restructuring and EV strategy reset. Most sources frame their targets as 12-month horizons rather than specific year-end levels, and several refer to the impact of large non-cash charges and changes to capital allocation plans.
TradingView (consensus rating and target range)
TradingView shows an average 12-month STLAM stock forecast of €8.43 for the referenced Milan-listed stock, based on 29 analysts, with the highest estimate at €11.86 and the lowest at €5.00. The same page notes that 32 analysts have issued ratings over the period, resulting in an overall ‘Buy’ consensus rating, as analysts assess sector conditions and company-specific developments when forming their projections (TradingView, 12 February 2026).
Investing.com (STLAM Milan-focused consensus)
Investing.com shows an average 12-month STLAM target of around €8.72, with individual estimates ranging from €5 to €12.50. The service describes the overall stance as Neutral, amid uncertainty surrounding sector conditions and the group’s earnings trajectory following prior volatility in the automotive sector.
Deutsche Bank (single-stock revision after charges)
Deutsche Bank update lowers its price target for Stellantis’ Milan listing to €7 after the company announced substantial restructuring and impairment charges. The report states that the bank revised its assumptions to reflect EV strategy-related costs and a softer near-term earnings outlook, while maintaining coverage under a cautious sector view (Investing.com, 9 February 2026).
Simply Wall St (aggregated analyst consensus)
Equity research aggregator Simply Wall St notes that Milan-listed shares trade around €8.66 compared with a consensus analyst target of approximately €9.93, implying the price sits about 13% below the average estimate at that time. The article explains that analysts incorporate recent restructuring charges and longer-term transition plans into their models, while retaining a cautious approach to auto demand assumptions (Simply Wall St, 5 February 2026).
Predictions and third-party forecasts are inherently uncertain, as they cannot fully account for unexpected market developments. Past performance is not a reliable indicator of future results.
STLAM stock price: Technical overview
The STLAM stock price is trading near €6.57 as of 10:33am UTC on 12 February 2026. The price remains below a broad cluster of daily moving averages, with the 20-, 50-, 100-, and 200-day SMAs positioned around €8–€9. The 14-day RSI, at roughly 30, sits in lower-neutral territory rather than deeply oversold. An ADX reading just above 32 points to an established trend environment rather than a range-bound structure.
On the upside, the nearest classic pivot above spot sits around €9.42, with €10.56 potentially coming into view on a sustained daily close above that initial resistance area. On pullbacks, the classic pivot near €8.72 represents the first level of support to monitor, followed by the 100-day SMA zone around €9 as a medium-term reference area. A sustained break below the €7.58 S1 level would expose the lower portion of the recent pivot structure, although price action would need to confirm continuation (TradingView, 12 February 2026).
This technical analysis is provided for informational purposes only and does not constitute financial advice or a recommendation to buy or sell any instrument.
Stellantis share price history (2024–2026)
Over the past two years, STLAM’s stock price has moved from double-digit levels to single digits, marking a significant reset into early 2026. The stock closed 2024 at around €12.60 on 30 December, then traded largely between €12 and €14 through early 2025, with February prices clustering near €13.50–€13.60. By late September 2024, it briefly reached the mid-€14 to €15 area before easing back towards the low €12s by year-end.
The trajectory shifted through 2025 and into 2026. The price moved lower from around €12.90 at the end of January 2025 to the high €8s–low €9s by mid-year, before fluctuating within an €8–€10 range during much of the autumn. After opening 2026 near €9.70 on 2 January, Stellantis declined steadily. A sharp move from €8.21 on 5 February to €6.23 on 6 February accelerated the transition into single digits. By 12 February 2026, the share price had closed at €6.61, placing it materially below levels seen a year earlier.
Past performance is not a reliable indicator of future results. Share prices are indicative and may differ from live market prices.
Stellantis (STLAM): Capital.com analyst view
Stellantis’ share price has reset into early 2026, moving from double-digit levels through much of 2024 and early 2025 to single digits following the announcement of a strategic overhaul and sizeable one-off charges. This adjustment has occurred against a mixed backdrop for European automotive stocks, where investors weigh softer EV demand, cost pressures, and regulatory developments alongside new model pipelines and efforts to protect margins and cash flow.
From a fundamental perspective, the €22.2bn in write-downs and related charges, the suspension of the 2026 dividend, and plans to issue up to €5bn in hybrid bonds have prompted reassessments of near-term earnings capacity and capital returns. These factors can influence sentiment. At the same time, some market participants view the reset as an attempt to address legacy issues, refocus investment, and strengthen the balance sheet. The longer-term outcome will likely depend on execution, product competitiveness, and broader auto-cycle conditions.
The wider sector context also presents both risks and potential offsets. A weaker economic cycle or policy uncertainty may weigh on valuations, while stabilisation in macro conditions, clearer emissions frameworks, and progress on product launches could alter market perceptions over time. Outcomes remain sensitive to both company-specific developments and external demand dynamics.
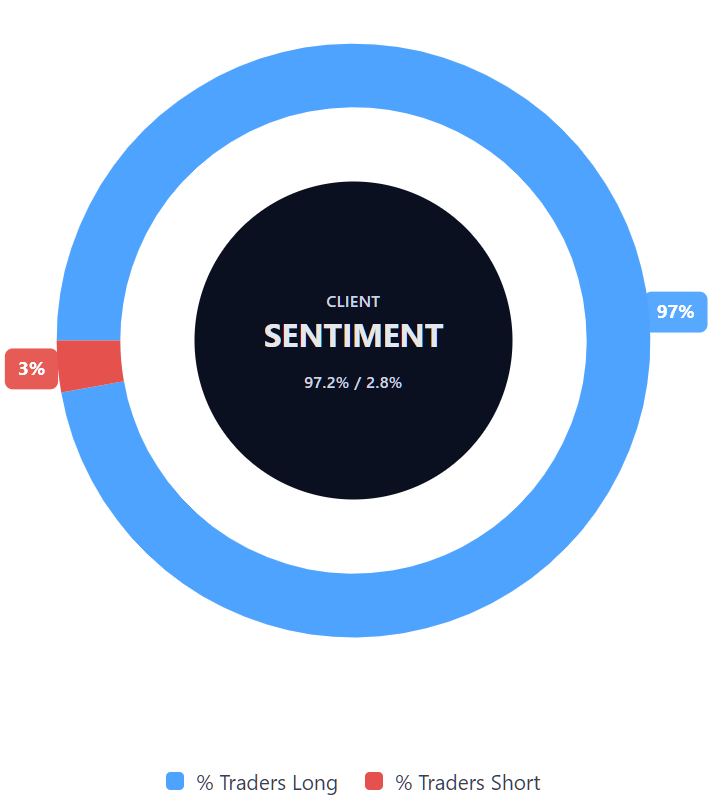
Capital.com’s client sentiment for Stellantis CFDs
As of 12 February 2026, Capital.com client positioning in Stellantis CFDs shows 97.2% buyers versus 2.8% sellers, indicating a pronounced long skew, with buyers ahead by 94.4 percentage points. This reflects open positions on the platform at the time of writing and may change as market conditions evolve.
Summary – Stellantis 2026
- Stellantis’ Milan-listed share price declined from around €13–€14 in early 2025 to the €8–€10 range by late 2025, before moving into single digits in early 2026.
- The stock recorded a sharp move from €8.21 on 5 February 2026 to €6.23 on 6 February, and closed at €6.61 on 12 February 2026, as the market reacted to the EV strategy reset and related charges.
- Recent technical readings show the price trading below clustered 20-, 50-, 100-, and 200-day moving averages near €8–€9. The 14-day RSI sits around 30, while the ADX above 30 indicates downside momentum within an established trend structure.
Past performance is not a reliable indicator of future results.
FAQ
Who owns the most Stellantis stock?
Stellantis’ shareholder base includes a mix of institutional investors, strategic long-term holders, and public shareholders across its Milan and New York listings. Historically, major stakes have been linked to founding shareholder groups such as Exor and Peugeot Invest, alongside large global asset managers. Ownership levels can change over time due to portfolio rebalancing, capital raises, or market transactions. Investors should review the latest regulatory filings to obtain the most up-to-date breakdown of significant shareholdings.
What is the 5-year Stellantis share price forecast?
Most published analyst estimates focus on 12-month price targets rather than five-year projections. Longer-term STLAM stock forecasts tend to rely on scenario-based modelling, incorporating assumptions about global vehicle demand, electrification strategy execution, cost control, regulation, and capital allocation. Given the scale of recent restructuring charges and strategic adjustments, five-year outcomes remain uncertain and sensitive to macroeconomic conditions. Investors should treat extended forecasts as indicative scenarios rather than fixed expectations.
Is Stellantis a good stock to buy?
Whether Stellantis is suitable for an investor depends on individual objectives, time horizon, and risk tolerance. The company operates in a cyclical industry and has recently announced significant restructuring measures, which may affect earnings visibility and valuation metrics. Some analysts reference valuation levels and strategic repositioning, while others highlight near-term operational and macroeconomic risks. This overview is for general information only and does not constitute investment advice. Any decision should follow independent research and careful consideration of personal financial circumstances.
Could Stellantis stock go up or down?
Should I invest in Stellantis stock?
Can I trade Stellantis CFDs on Capital.com?
Yes, you can trade Stellantis CFDs on Capital.com. Trading share CFDs lets you speculate on price movements without owning the underlying asset and to take long or short positions. However, contracts for difference (CFDs) are traded on margin, and leverage amplifies both profits and losses. You should ensure you understand how CFD trading works, assess your risk tolerance, and recognise that losses can occur quickly.