Boeing stock forecast: 737 MAX wiring rework
Boeing (BA) shares moved after it paused 737 MAX deliveries for wiring rework, while separate reports pointed to a possible large 737 MAX order from China. Past performance is not a reliable indicator of future results. Explore third-party BA price targets and technical analysis.
The Boeing Company (BA) is trading at $213.08 in afternoon trading at 12:04pm UTC on 12 March 2026, within an intraday range of $212.34–$218.70. Past performance is not a reliable indicator of future results.
Boeing's share price has been weighed down after the company confirmed it paused 737 MAX deliveries to perform rework on a batch of undelivered aircraft with scratched wiring caused by a machining error, with 737 programme VP Katie Ringgold stating the issue would be resolved in ‘days, not weeks’ and that full-year delivery targets of approximately 500 aircraft remain unchanged (Aviation Week, 10 March 2026). The stock had rallied earlier in the week amid reports that Boeing is close to a landmark order of around 500 737 MAX jets from China, anticipated to be announced around a Trump–Xi summit (Reuters, 6 March 2026), while the broader S&P 500 closed at 6,781.5 on 11 March amid a volatile session shaped by geopolitical concerns and falling energy prices (Yahoo Finance, 11 March 2026).
Boeing stock forecast 2026–2030: Third-party price targets
As of 12 March 2026, third-party Boeing stock predictions reflect a range of views on the company's production recovery, free cash flow trajectory, and near-term delivery execution. The following summaries draw exclusively on broker notes and consensus data published between 28 February and 12 March 2026.
Jefferies (Buy reiteration)
Jefferies reiterates a Buy rating and a $295 price target on BA, following Boeing's February delivery data. The firm’s reiteration follows solid 737 MAX delivery figures, with Jefferies citing the monthly delivery run-rate as consistent with Boeing's full-year production targets (Investing.com, 4 March 2026).
Bank of America Securities (Buy reiteration)
Bank of America Securities analyst Ronald Epstein reaffirms a Buy rating and a $270 price target on BA. The reiteration comes amid Boeing's Q4 2025 beat on revenues of $23.9 billion versus consensus of $22.3 billion, with Epstein framing the recovery as an execution-driven story across both commercial and defence segments (Yahoo Finance, 26 February 2026).
MarketBeat (broker consensus)
MarketBeat aggregates ratings from 26 brokerages and reports a consensus rating of 'Moderate Buy' with a mean 12-month price target of $246.14. The aggregate spans 17 buy ratings, 5 holds, 3 sells, and 1 strong buy, amid ongoing scrutiny over Boeing's 737 MAX wiring rework and first-quarter delivery pace (MarketBeat, 12 March 2026).
Public.com (analyst aggregate)
Public.com places the average Wall Street price target for BA at $251, compiled from 18 analyst estimates, with a consensus rating of Buy. The aggregate reflects expectations tied to Boeing's 737 MAX production ramp toward 47 aircraft per month later in 2026, alongside the company's reaffirmed full-year free cash flow guidance of $1 billion–$3 billion (Public.com, 10 March 2026).
MarketScreener (consensus overview)
MarketScreener compiles a consensus from 26 analysts with a mean rating of Buy and an average 12-month BA stock forecast of $271.62, spanning a range of $140–$298 as of 6 March 2026. The breadth of the range reflects divergent views on the pace of Spirit AeroSystems reintegration, defence programme charge risk, and the timing of cash flow normalisation beyond 2026 (MarketScreener, 6 March 2026).
Predictions and third-party forecasts are inherently uncertain, as they cannot fully account for unexpected market developments. Past performance is not a reliable indicator of future results.
BA stock price: Technical overview
The BA stock price trades at $213.08 as of 12:04pm UTC on 12 March 2026, sitting below its entire moving-average stack after a sustained pullback from the $230s. The 20/50/100/200-day SMAs are arrayed at approximately $230 / $235 / $219 / $219, with all four above the current price and each carrying a sell signal, leaving BA in a position where every major moving average acts as overhead resistance rather than support.
Momentum is weak but not yet at an extreme: the 14-day RSI registers 34.81, hovering in the lower neutral range and approaching, though not yet confirming, oversold territory. The ADX(14) reads 21.64, shy of the 25 threshold that would signal a firmly established trend, suggesting the current directional move lacks strong conviction.
On the topside, the classic pivot at $233.43 (P) is the first level to reclaim; a daily close above that level would bring R1 at approximately $242 into view. Beyond that, R2 near $256 becomes the next meaningful reference if near-term selling pressure eases.
On the downside, initial support rests at S1 near $219.01, which also broadly coincides with the 100-day SMA at $218.58–that confluence makes the $218–$219 area the key structural shelf to watch. Losing that zone on a daily closing basis would increase the risk of a deeper move toward S2 near $210, with S3 at approximately $188 a longer-term reference if deterioration accelerates (TradingView, 12 March 2026).
This is technical analysis for informational purposes only and does not constitute financial advice or a recommendation to buy or sell any instrument.
Boeing share price history (2024–2026)
BA’s stock price opened March 2024 around $183, part of a prolonged period of volatility that had weighed on the stock since the January 2024 door-plug incident on an Alaska Airlines 737 MAX 9.
BA slid steadily through mid-2024, touching a two-year low near $138 on 7 April 2025 as a broader tariff-driven market sell-off compounded the company's existing quality and production headwinds. The stock closed 2024 at $177.43 and began 2025 under similar pressure, briefly dipping toward the $140s in early April before staging a sustained recovery through the summer.
From that April 2025 floor, BA climbed through the $180s and $190s, reaching a two-year high around $260 intraday on 27 January 2026 amid reports around a potential large-scale China jet order and improving delivery numbers. The stock closed 2025 at $218.10, representing a roughly 23% gain from the December 2024 close of $177.43.
BA closed at $213.50 on 12 March 2026, approximately 2.1% down year to date from the 31 December 2025 close of $218.10, and around 34% higher year on year from $159.58 on 12 March 2025, with recent pressure stemming from a 737 MAX wiring rework disclosure earlier in March.
Past performance is not a reliable indicator of future results. Share prices are indicative and may differ from live market prices.
Boeing (BA): Capital.com analyst view
Boeing's BA shares have traced a significant recovery arc over the past 12 months, climbing from around $140 in early April 2025 to an intraday high near $260 in late January 2026, as market focus shifted toward the company's improving delivery cadence and its return to profitability in full-year 2025, with revenue reaching $89.46 billion and net income of $2.24 billion, according to Boeing's own figures. The stock's recovery reflects a stronger emphasis on management's targets of positive free cash flow of $1 billion–$3 billion in 2026 and a 737 MAX production ramp toward 47 aircraft per month, supported by a backlog exceeding $636 billion. That said, a fresh wiring defect affecting undelivered 737 MAX aircraft, disclosed in early March 2026, illustrates how quickly execution setbacks can weigh on the share price, with BA pulling back to around $213 from the highs above $240 seen in February.
The investment case carries meaningful risk on both sides. Bulls point to a record order pipeline, FAA approval for higher production rates, and a potential large-scale China jet order as factors that could support further re-rating; bears note that Boeing's debt load remains substantial, the 777X certification process extends into late 2026, Spirit AeroSystems integration presents ongoing execution risk, and the stock still trades roughly 80% below its 2019 highs, meaning the recovery story remains incomplete.
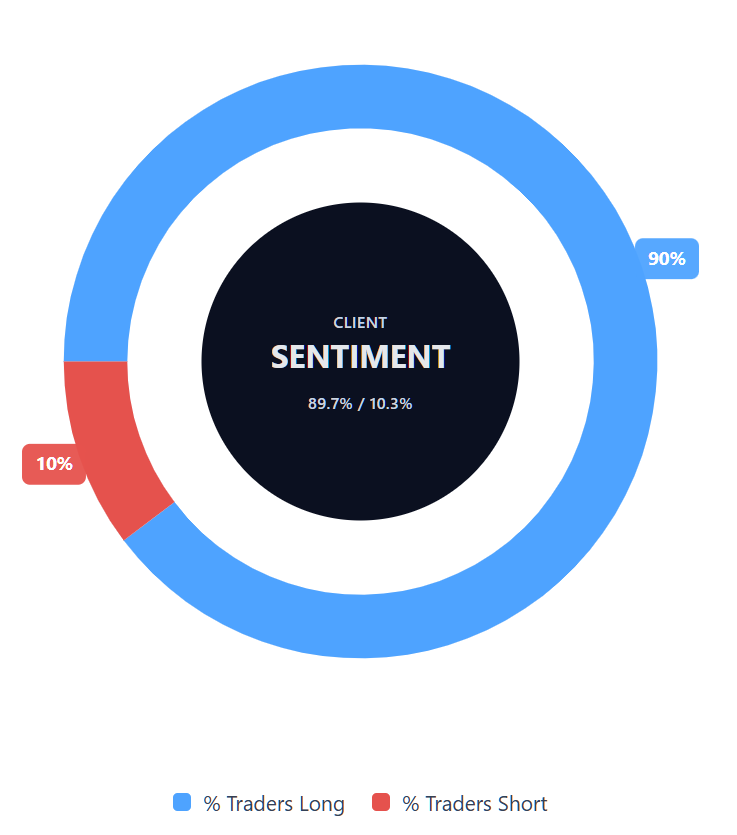
Capital.com’s client sentiment for Boeing CFDs
As of 12 March 2026, Capital.com client positioning in Boeing CFDs shows buyers at 89.7% versus sellers at 10.3%, putting buyers ahead by 79.4 percentage points and placing sentiment firmly in heavy-buy, one-sided long territory. This snapshot reflects open positions on Capital.com and can change rapidly as market conditions evolve.
Summary – Boeing 2026
- BA trades at $213.08 as of 12:04pm UTC on 12 March 2026, down from a January 2026 intraday high near $260 and up roughly 34% year on year.
- All major moving averages sit above the current price and carry sell signals, with RSI at 34.81 approaching, but not yet confirming, oversold territory.
- Key price drivers include Boeing's 737 MAX production ramp, free cash flow recovery targets of $1 billion–$3 billion in 2026, and a potential large-scale China jet order.
- A wiring defect requiring rework on undelivered 737 MAX aircraft, disclosed on 10 March 2026, has pressured the stock from February highs above $240.
Past performance is not a reliable indicator of future results.
FAQ
Who owns the most Boeing stock?
What is the 5 year Boeing share price forecast?
Is Boeing a good stock to buy?
Could Boeing stock go up or down?
Should I invest in Boeing stock?
Can I trade Boeing (BA) CFDs on Capital.com?
Yes, you can trade Boeing CFDs on Capital.com. Trading share CFDs lets you speculate on price movements without owning the underlying asset and to take long or short positions. However, contracts for difference (CFDs) are traded on margin, and leverage amplifies both profits and losses. You should ensure you understand how CFD trading works, assess your risk tolerance, and recognise that losses can occur quickly.