Bayer stock forecast: Q4 loss, negative 2026 FCF
Bayer (BAYN) is a German life-sciences group listed in Frankfurt; Q4 included a €3.76bn net loss and 2026 guidance points to negative free cash flow and €9.6–€10.1bn adjusted EBITDA. Past performance is not a reliable indicator of future results. Explore third-party BAYN price targets and analysis.
Bayer AG (BAYN) is trading at €39.75 as of 11:43am UTC on 12 March 2026, within an intraday range of €38.85–€40.10 on Capital.com's quote feed. Past performance is not a reliable indicator of future results.
Pressure on BAYN has been shaped by several converging factors. Bayer reported a €3.76 billion net loss in Q4 driven by legal provisions and guided for negative free cash flow in 2026, with the company forecasting adjusted EBITDA of €9.6–€10.1 billion (Bayer, 4 March 2026), broadly flat year on year. The broader European equity backdrop has also softened, with the DAX posting a one-month low of 22,670 on 9 March 2026 amid geopolitical tensions in the Middle East (Reuters, 4 March 2026).
Bayer stock forecast 2026–2030: Third-party price targets
As of 12 March 2026, third-party Bayer stock predictions span a wide range, shaped primarily by the proposed $7.25 billion Roundup class settlement, the company's below-consensus 2026 earnings guidance, and differing assumptions on cash flow recovery. The following briefs summarise five broker and consensus views published between 28 February and 12 March 2026, ordered from lowest to highest price target.
Deutsche Bank (broker note – Neutral)
Deutsche Bank reiterates a Neutral rating on BAYN with a price target of €23. Analyst Falko Friedrichs maintains the cautious stance amid negative free cash flow guidance for 2026 and ongoing uncertainty around the US Supreme Court's pending decision in the Durnell glyphosate case (MarketScreener, 5 March 2026).
Berenberg (broker note – Hold)
Berenberg maintains a Hold rating on BAYN with a price target of €40. Analyst Sebastian Bray flags that while the preliminary US approval of the Roundup class settlement is a constructive step, the US Supreme Court ruling in the Durnell case remains an important outstanding variable for the litigation liability total (The Globe and Mail, 6 March 2026).
Barclays (broker note – Buy)
Barclays reiterates a Buy rating on BAYN with a price target of €48. Analyst Charles Pitman-King considers the stock attractive at current levels, citing the preliminary US court approval of the glyphosate settlement as a meaningful de-risking event ahead of the separate Durnell Supreme Court proceedings (MarketScreener, 11 March 2026).
JPMorgan (broker note – Overweight)
JPMorgan maintains an Overweight rating on BAYN with a price target of €50. Analyst Richard Vosser describes Q4 2025 results as solid while noting that Bayer's 2026 adjusted earnings guidance implies an approximate 3% currency-related downward revision to prevailing consensus estimates (MarketScreener, 4 March 2026).
Goldman Sachs (broker note – Buy)
Goldman Sachs reiterates a Buy rating on BAYN with a price target of €54.50. Analyst James Quigley raises the target marginally from €54, citing no major change to the investment thesis while recognising the settlement framework progress and the pipeline as supporting a sustained recovery in the group's valuation (MarketScreener, 5 March 2026).
Predictions and third-party forecasts are inherently uncertain, as they cannot fully account for unexpected market developments. Past performance is not a reliable indicator of future results.
BAYN stock price: Technical overview
The BAYN stock price trades at €39.75 as of 11:43am UTC on 12 March 2026, sitting inside a mixed moving-average picture where the 10-day SMA at €38.93 and the 100/200-day SMAs at €36.62 and €32 are supportive, while the 20/50-day SMAs at €41.76 and €42.58 overhead continue to act as resistance. The short-term EMAs (10-day at €39.58) are aligned with price, but the longer-tenor averages keep the broader setup under pressure.
The 14-day RSI reads 43.4, a neutral reading that reflects neither momentum exhaustion nor building strength; the ADX at 31.9 indicates an established trend is in force, consistent with the prevailing sell signals from the 20- through 50-day moving-average family. Price has not yet recovered to the key moving-average shelf in the €41–43 area that would flip medium-term signals.
On the topside, the classic R1 pivot at €47.45 is the first reference to watch; a convincing daily close above that level would put R2 near €52.88 back in view. The round €45 figure also sits within that zone as an interim area of interest, given the cluster of EMAs in the €40.76–€41.29 range just beneath.
On the downside, the classic pivot at €44.35 now acts as overhead support-turned-resistance rather than a nearby floor; near-term support rests at the classic S1 at €38.91, which broadly coincides with current trade. Losing that level on a daily close would increase the risk of a move toward S2 near €35.81, with the 100-day SMA at €36.62 providing the next meaningful structural shelf beneath (TradingView, 12 March 2026).
This is technical analysis for informational purposes only and does not constitute financial advice or a recommendation to buy or sell any instrument.
Bayer share price history (2024–2026)
BAYN’s stock price was trading in the mid-to-high €20s through most of spring and summer 2024, with the stock hovering near €28–€30 between April and October 2024 before selling pressure intensified in the final quarter. From a high of €30.50 on 1 October 2024, BAYN slid steadily, closing out December 2024 at €19.40 – a decline of around 36% across the final three months of the year as litigation concerns and earnings pressure weighed on the stock.
The sell-off deepened into early 2025. BAYN opened January 2025 near €19.45 and continued drifting lower, bottoming near €19.05 on 3 January before a modest recovery brought the stock back to around €22–€23 by late February and early March. A brief spike toward €25.55 on 6 March 2025 faded quickly, with the shares retreating to the low €20s through April and May, touching a low near €19.60 on 9 April 2025 amid broader market volatility.
A sustained recovery began in the second half of 2025. BAYN climbed from approximately €22.90 in mid-May to the high €20s by late summer, then pushed above €30 in late September and early October before pulling back again. A sharp move higher arrived in November 2025, with the stock surging from around €26.55 to €30.90 by month-end, then continuing to €36–€37 through December 2025.
The rally extended into 2026. BAYN opened the year at €38.05, reached a local peak of €49.50 on 17 February 2026, then retreated as below-consensus full-year guidance and Roundup litigation uncertainty prompted a sell-off. The stock closed at €39.75 on 12 March 2026, approximately 4.5% higher year to date but around 19.7% below its February 2026 high.
Past performance is not a reliable indicator of future results. Share prices are indicative and may differ from live market prices.
Bayer (BAYN): Capital.com analyst view
Bayer's BAYN shares have experienced notable volatility over the past year, climbing from the low €20s in early 2025 to a high of €49.50 in February 2026 before retracing to around €39.75 as of 12 March 2026. The February rally reflected growing market focus on the proposed $7.25 billion Roundup class settlement, which received preliminary court approval in Missouri in early March 2026 and which Bayer frames as a potential multi-decade resolution of glyphosate litigation. However, the subsequent pullback illustrates how quickly sentiment can shift: the settlement still requires final court approval, class members can opt out until June 2026, and Bayer has indicated the arrangement could be withdrawn if participation falls short.
The near-term earnings picture adds another layer of complexity. Bayer's 2026 adjusted EBITDA guidance of €9.6–€10.1 billion came in below analyst consensus, and the company has guided for negative free cash flow this year due to approximately €5 billion of anticipated litigation-related cash outflows. A favourable US Supreme Court ruling on the Durnell pre-emption case, expected by June 2026, could reduce the scope of future glyphosate claims and support a re-rating of the stock; an adverse outcome, conversely, could expose Bayer to further state-court proceedings and extend the litigation runway beyond current provisions.
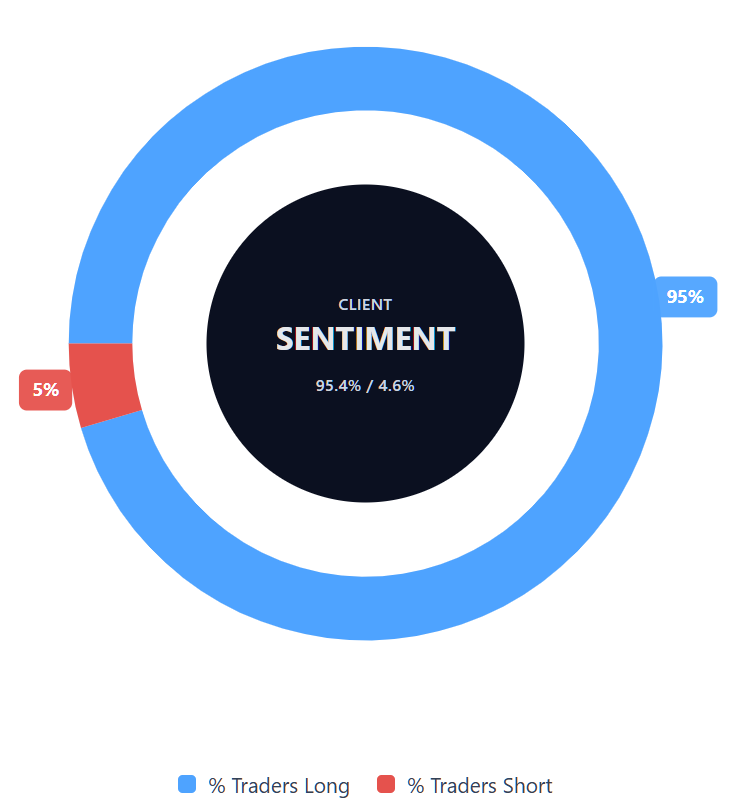
Capital.com’s client sentiment for Bayer CFDs
As of 12 March 2026, Capital.com client positioning in Bayer CFDs shows 95.4% buyers vs 4.6% sellers, putting buyers ahead by 90.8 percentage points and indicating a pronounced long bias. This snapshot reflects open positions on Capital.com at the time of writing and can change rapidly as market conditions evolve.
Summary – Bayer 2026
- As of 11:43am UTC on 12 March 2026, BAYN trades at €39.75, within an intraday range of €38.85–€40.10, and roughly 19.7% below its February 2026 high of €49.50.
- Technical indicators show a mixed picture: the 10-day SMA is supportive near €38.93, while the 20- and 50-day SMAs at €41.76 and €42.58 act as near-term overhead resistance.
- The 14-day RSI reads 43.4 (neutral) and the ADX at 31.9 suggests an established trend is in force, with classic support at S1 near €38.91 and the 100-day SMA shelf at €36.62 below.
- The primary price driver is Bayer's proposed $7.25 billion Roundup class settlement, which received preliminary court approval in March 2026 but still faces final approval and opt-out risk.
- A US Supreme Court ruling on the Durnell pre-emption case is expected by June 2026, with a favourable outcome potentially reducing future glyphosate liability and an adverse ruling extending it.
Past performance is not a reliable indicator of future results.
FAQ
Who owns the most Bayer stock?
What is the 5 year Bayer share price forecast?
Is Bayer a good stock to buy?
Could Bayer stock go up or down?
Should I invest in Bayer stock?
Can I trade Bayer (BAYN) CFDs on Capital.com?
Yes, you can trade Bayer CFDs on Capital.com. Trading share CFDs lets you speculate on price movements without owning the underlying asset and to take long or short positions. However, contracts for difference (CFDs) are traded on margin, and leverage amplifies both profits and losses. You should ensure you understand how CFD trading works, assess your risk tolerance, and recognise that losses can occur quickly.