SoFi Technologies stock forecast: SoFiUSD Mastercard settlement
SoFi Technologies (SOFI) is a US-based digital financial services company, recently reporting Q4 2025 revenue of $1.01bn and expanding its SoFiUSD stablecoin partnership with Mastercard. Past performance is not a reliable indicator of future results. Explore third-party SOFI price targets.
SoFi Technologies, Inc. (SOFI) is trading at $18.44 as of 4:48pm UTC on 10 March 2026, within an intraday range of $17.88–$19.02. The current price sits below the $19.10 level at which the stock traded on 5 March 2026, reflecting ongoing consolidation after shares pulled back from January highs above $29.90. Past performance is not a reliable indicator of future results.
Sentiment around SOFI reflects a combination of company-specific catalysts and broader market volatility. SoFi reported Q4 2025 adjusted net revenue of $1.01bn, up 37% year on year and marking its first quarter above the $1bn threshold, with adjusted EPS of $0.13 beating the consensus estimate of $0.11, according to the company’s earnings release (Investing.com, 30 January 2026). More recently, SoFi and Mastercard announced an enhanced partnership to enable SoFiUSD, SoFi’s fully reserved US dollar stablecoin, as a settlement option across Mastercard’s global payments network. Galileo – SoFi’s technology platform – is among the first to offer the option to its issuing bank clients (Mastercard. 3 March 2026).
At the broader market level, the S&P 500 and Dow have faced pressure amid US–Iran conflict-related oil price volatility. Crude retreated towards $88.75 per barrel on 10 March 2026 after an earlier spike towards $120 (24/7 Wall St., 10 March 2026), while equities staged a partial recovery after President Trump signalled the conflict may be nearing an end (CNBC. 10 March 2026).
SoFi Technologies stock forecast 2026–2030: Third-party price targets
As of 10 March 2026, third-party SoFi Technologies stock predictions reflect a broadly cautious-to-constructive stance following the company’s record Q4 2025 results. Twelve-month price targets span a wide range as analysts weigh strong revenue growth against macroeconomic and credit-quality risks.
MarketBeat (broker consensus, Hold rating)
MarketBeat aggregates 18 analyst ratings and reports an average 12-month SOFI stock forecast of $26.34. The published range spans from $20.50 at the low end to $31 at the high end. The consensus rating stands at Hold, comprising three Sell, eight Hold and seven Buy recommendations. The platform highlights the SoFiUSD stablecoin partnership with Mastercard and CEO Anthony Noto’s $1m open-market share purchase as among the near-term factors referenced across the covered research (MarketBeat, 3 March 2026).
Public.com (consensus snapshot)
Public.com aggregates 13 analyst ratings, arriving at a consensus Hold rating and an average 12-month price target of $26.04. The breakdown shows 15% Strong Buy, 23% Buy, 46% Hold and 15% Sell. The platform notes that Q4 2025 revenue of $1.025bn, a 39.6% year-on-year increase, alongside record deposits of $37.4bn, supports the more constructive targets. At the same time, credit-quality concerns and softer personal loan demand underpin the more cautious estimates (Public.com, 10 March 2026).
TipRanks (consensus snapshot)
TipRanks reports that, as of 10 March 2026, 15 analysts have issued 12-month price targets on SOFI, with an average target of $25.96. The published range extends from a low of $18 to a high of $38. The consensus rating is Hold, indicating a balanced distribution of views as analysts weigh growth prospects against valuation sensitivity and macroeconomic uncertainty (TipRanks, 10 March 2026).
Predictions and third-party forecasts are inherently uncertain, as they cannot fully account for unexpected market developments. Past performance is not a reliable indicator of future results.
SOFI stock price: Technical overview
The SOFI stock price trades at $18.44 as of 4:48pm UTC on 10 March 2026, sitting below its full moving-average stack. The 20-, 50-, 100- and 200-day SMAs stand at $19, $23, $25 and $24 respectively, forming layered overhead resistance. The short-term 20-day SMA remains below the 50-day SMA, and all tracked averages from the 10-day through to the 200-day indicate sell signals, suggesting sustained near-term pressure.
The 14-day RSI at 37.05 sits in lower-neutral territory, consistent with softening momentum but not yet in oversold conditions. The ADX at 39.74 indicates an established trend, suggesting that recent downside pressure reflects directional movement rather than rangebound trading.
On the upside, the classic pivot resistance level (R1) at $21.64 represents the first notable reference point. A daily close above this level would bring R2 near $25.53 into view, broadly aligning with the 50-day SMA zone at $22.80–$23.37 as an intermediate resistance area.
On pullbacks, the classic pivot point (P) at $19.48 sits just above the current price and may act as a near-term reference during recovery attempts. A move below the intraday low of $17.88 would expose S1 at $15.59, with S2 near $13.43 as the next reference on a sustained decline (TradingView, 10 March 2026).
This technical analysis is for informational purposes only and does not constitute financial advice or a recommendation to buy or sell any instrument.
SoFi Technologies share price history (2024–2026)
SOFI’s stock price opened March 2024 near $7.71, during a prolonged period of subdued price action that kept the stock largely within the $6.50–$8 range through much of mid-2024.
The stock began a more sustained recovery in Q4 2024, climbing from around $7.90 in late September to close the year at $15.43 on 31 December 2024, roughly doubling over three months as sentiment towards growth-focused financials improved. Momentum extended into early 2025, with SOFI reaching $18.12 in late January before pulling back. The stock then drifted lower through spring, touching $9.56 on 4 April 2025 amid the broader market sell-off that followed the announcement of US tariffs.
Recovery through summer 2025 was gradual. SOFI climbed towards $30 by late November, briefly touching $32.76 on 12 November, before easing to close the year at $26.16 on 31 December 2025. A strong start to 2026 saw SOFI spike to $29.90 on 5 January. However, Q4 2025 earnings-day volatility on 30 January sent the stock sharply lower, closing at $22.91 after reaching an intraday high of $26.37.
SOFI closed at $18.56 on 10 March 2026, approximately 29.0% lower year to date and 72.6% higher year on year.
Past performance is not a reliable indicator of future results. Share prices are indicative and may differ from live market prices.
SoFi Technologies (SOFI): Capital.com analyst view
SoFi Technologies’ share price has experienced significant volatility over the past year, recovering from a low near $9.56 in April 2025 to reach $32.76 in November 2025, before retracing to around $18.44 as of 10 March 2026. The move higher coincided with the company surpassing $1bn in quarterly revenue for the first time and expanding into stablecoin infrastructure through the SoFiUSD–Mastercard partnership. These developments indicate operational progress, though the subsequent pullback illustrates how sentiment towards high-beta fintech stocks can shift quickly, particularly when credit-cycle concerns or broader market volatility re-emerge.
Analyst opinion remains divided. Twelve-month price targets range from $20.50 to $31, with a consensus Hold rating. More constructive views focus on diversifying revenue streams and improving profitability metrics, while cautious perspectives highlight softer personal loan demand and potential valuation pressure if interest rates remain elevated.
This analysis is provided for informational purposes only and does not constitute investment advice.
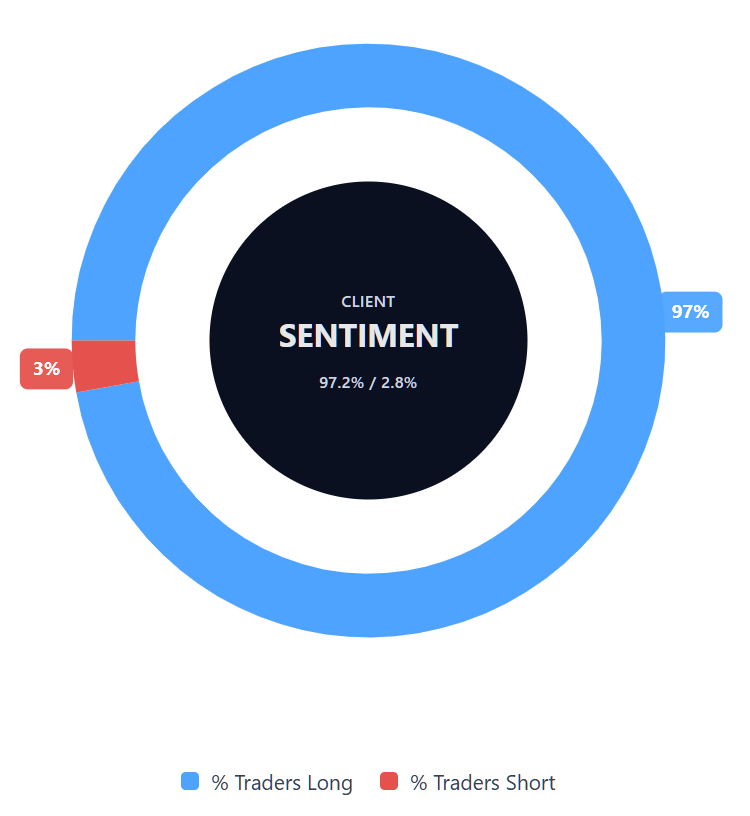
Capital.com’s client sentiment for SoFi Technologies CFDs
As of 10 March 2026, Capital.com client positioning in SoFi Technologies CFDs shows 97.2% buyers versus 2.8% sellers, leaving buyers ahead by 94.4 percentage points. This positioning reflects open CFD positions on the Capital.com platform and may change as market conditions evolve.
Summary – SoFi Technologies 2026
- As of 4:48pm UTC on 10 March 2026, SOFI trades at $18.44, down around 29% year to date but approximately 72% higher year on year.
- The stock has retraced from its November 2025 high near $32.76 and its January 2026 peak around $29.90, highlighting continued two-way volatility.
- All major moving averages from the 10-day to the 200-day SMA currently indicate sell signals. The 14-day RSI at 37.05 sits in lower-neutral territory, while the ADX at 39.74 signals an established downtrend.
- The classic pivot level at $19.48 sits just above the current price. A sustained break below the $17.88 intraday low would expose S1 near $15.59.
- Key supportive factors cited by analysts include record Q4 2025 revenue of $1.025bn, FY 2026 adjusted EBITDA guidance and the SoFiUSD integration across Mastercard’s global payments network.
- Identified risks include credit-cycle normalisation, softer personal loan demand and broader valuation pressure in growth-focused financial stocks if interest rates remain elevated.
Past performance is not a reliable indicator of future results.
FAQ
Who owns the most SOFI stock?
What is the 5 year SOFI share price forecast?
Is SOFI a good stock to buy?
Could SOFI stock go up or down?
Should I invest in SOFI stock?
This article is for information only and does not provide investment advice. If you’re considering exposure to SOFI, it may help to assess what you’re actually seeking (short-term price movement versus long-term fundamentals), what level of drawdown you could tolerate, and how the position fits within a broader risk plan. It’s also worth reviewing the key risks highlighted earlier, including credit quality, loan demand, and rate-driven valuation pressure.
Can I trade SOFI CFDs on Capital.com?
Yes, you can trade SoFi Technologies CFDs on Capital.com. Trading share CFDs lets you speculate on price movements without owning the underlying asset and to take long or short positions. However, contracts for difference (CFDs) are traded on margin, and leverage amplifies both profits and losses. You should ensure you understand how CFD trading works, assess your risk tolerance, and recognise that losses can occur quickly.