Silver price forecast: Middle East tensions, firmer US Dollar
Silver (XAG) has pulled back after a rally linked to Middle East tensions, trading within an $88-95 range as a firmer US dollar and profit-taking followed a move back above $90/oz. Past performance is not a reliable indicator of future results.
Silver (XAG/USD) is trading around $85.97 per troy ounce as of 10:57am UTC on 4 March 2026, within an intraday range of $79.54-90.91 on Capital.com’s platform. This leaves prices near the upper end of the recent international spot range, after the metal tested levels near $96.40 per ounce in prior sessions amid heightened volatility across precious metals markets. Past performance is not a reliable indicator of future results.
The move follows a pullback in global silver prices after a sharp rally linked to geopolitical tensions in the Middle East (Finance Magnates, 3 March 2026), with recent trade described within a volatile $88-95 per ounce band in international spot markets (Natural Resource Stocks. 3 March 2026). Broader drivers include profit-taking after the surge to multi-week highs (Roic AI, 2 March 2026), a firmer US dollar weighing on dollar-denominated commodities (Trading Economics, 4 March 2026), and ongoing safe-haven demand tied to geopolitical and macroeconomic uncertainty, which recently pushed prices back above $90 per ounce (Fortune, 2 March 2026).
Silver price forecast 2026-2030: Analyst price target view
As of 4 March 2026, third-party Silver predictions span a wide range, shaped by industrial demand trends, tariff policy, the gold-to-silver ratio and physical market supply constraints. The following targets summarise forecasts from leading institutions and research services published in February and March 2026.
Reuters (consensus poll)
A Reuters poll published in early February 2026 puts the average silver price at $79.50/oz for 2026 as a whole, with forecasts raised after silver’s sharp rally from around $29/oz at the start of 2025. The poll notes that analysts expect volatility to remain elevated, citing weaker industrial and jewellery demand as potential drivers of pullbacks (Reuters, 4 February 2026).
J.P. Morgan (2026 annual average)
J.P. Morgan Global Research sets its 2026 annual average silver price forecast at $81/oz, revised upward from a prior estimate of $56.30/oz. Quarterly projections range from $84/oz in Q1 to $85/oz in Q4. Gregory Shearer, head of base and precious metals strategy, points to multi-year physical market deficits, Section 232 tariff uncertainty, and strong Chinese and Indian retail investment demand as structural supports. He also highlights substitution risks in solar manufacturing and the absence of central bank buying as potential constraints (J.P. Morgan Global Research, 10 February 2026).
BeinCrypto (technical outlook)
BeinCrypto’s March 2026 technical analysis identifies a consolidation range of $75-92 as the most probable near-term path. It states that a daily close above $84 would be needed to confirm a cup-and-handle neckline, while a move above $91-92 would be required to validate a breakout towards $100/oz. The analysis highlights four bullish signals – including COMEX backwardation, which it interprets as reflecting tight physical supply – alongside three cautionary indicators, including declining COMEX open interest and hidden bearish divergence (BeinCrypto, 21 February 2026).
Bank of America (ratio-based scenario range)
Bank of America’s metals research head, Michael Widmer, projects a 2026 scenario range of $135-309/oz, derived from historical gold-to-silver ratio compression. The $135 level reflects the 2011 ratio low of 32:1, while the $309 extreme refers to the 1980 Hunt Brothers ratio of 14:1. The bank presents these as ratio-compression scenarios rather than base-case forecasts, with outcomes dependent on how far the gold-to-silver ratio narrows from current levels (Yahoo Finance, 28 February 2026).
PhysicalGold.com (supply-deficit view)
PhysicalGold reports that Citigroup forecasts silver reaching $100/oz by March 2026, with further upside to $110/oz by the end of Q2. The report attributes this view to tight physical supply, noting that COMEX registered inventories have fallen by more than 70% since 2020. It also cites industrial demand from solar, electric vehicles and AI-related hardware, alongside mine supply growth of around 1-2% per year, as contributing factors (PhysicalGold, 21 January 2026).
Predictions and third-party forecasts are inherently uncertain, as they cannot fully account for unexpected market developments. Past performance is not a reliable indicator of future results.
Silver price: Technical overview
Silver’s price trades at $85.97 as of 10:57am UTC on 4 March 2026, sitting just below a short-term moving average cluster – the 20/50/100/200-day SMAs at approximately $83, $84, $69 and $54 respectively – with price holding above all four. This alignment keeps the broader trend structure tilted to the upside, although momentum indicators point to consolidation. The 20-over-50 SMA configuration remains intact. The 200-day EMA near $60 and the 100-day EMA around $72 reinforce the longer-term upward bias.
The 14-day RSI stands at 51.1, a neutral reading that reflects consolidation rather than directional conviction. The ADX at 20.9 remains below the 25 threshold commonly associated with a trending market.
On the topside, the first reference level is the classic R1 pivot at $104.07; a daily close above that level would bring R2 at $114.84 into view. The Ichimoku base line at $92.84 sits below R1 and may act as an intermediate reference.
On pullbacks, initial support lies at the classic pivot at $83.98, broadly aligned with the 50-day SMA near $84. A sustained move below this area could expose S1 at $73.21, with the 100-day SMA at $68.61 marking the next moving average support (TradingView, 4 March 2026).
This technical analysis is provided for informational purposes only and does not constitute financial advice or a recommendation to buy or sell any instrument.
Silver price history (2024–2026)
The Silver price opened March 2024 around $23.73/oz, trading within a relatively tight range before breaking higher in the spring.
Prices climbed through April and May 2024, reaching an intraday peak of $32.54/oz on 20 May before easing as the US dollar strengthened. Silver closed 2024 at $28.91/oz – up roughly 22% from the March 2024 open – before a stronger rally developed in 2025.
During 2025, industrial demand growth, a weaker US dollar and rising safe-haven interest coincided with a substantial move higher. Silver opened 2025 at $29/oz and closed the year at $71.65/oz, a gain of approximately 147% over 12 months.
Volatility increased further in early 2026. XAG rose from $72.70/oz on 1 January to an intraday high of $121.69/oz on 29 January – a 61.8% move in under a month – before reversing sharply to $67.27/oz on 5 February. Silver then recovered, climbing back above $95/oz by 1 March before easing to trade at $86.05/oz as of 4 March 2026. This leaves the metal approximately 18.4% higher year to date and around 169% above its level a year earlier.
Past performance is not a reliable indicator of future results. Share prices are indicative and may differ from live market prices.
Silver price outlook: Capital.com analysis
Silver’s strong performance over the past two years reflects a combination of industrial and macroeconomic drivers. Growth in solar panel manufacturing, electric vehicle components and AI-related electronics has supported demand, while periods of US dollar weakness have coincided with stronger international buying interest.
However, silver’s industrial exposure can also introduce downside risk. A slowdown in global manufacturing or changes in clean energy policy could affect consumption. In addition, silver’s market is smaller and typically less liquid than gold, which can contribute to sharper price swings in both directions.
The reversal from January 2026’s intraday high of $121.69/oz to $67.27/oz within days illustrates how quickly sentiment and positioning can shift. Speculative flows, liquidity conditions and currency movements may amplify price action beyond underlying supply-demand dynamics.
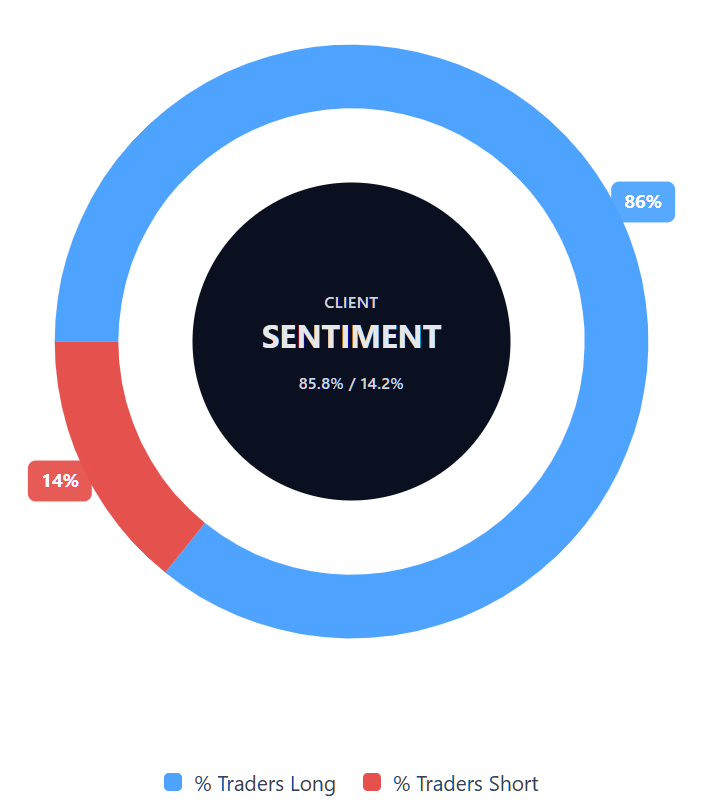
Capital.com’s client sentiment for Silver CFDs
As of 4 March 2026, Capital.com client positioning in Silver spot CFDs shows 85.8% buyers and 14.2% sellers at the time of writing. Buyers outnumber sellers by 71.7 percentage points, indicating a strong net-long bias among active accounts. This snapshot reflects open CFD positions on Capital.com and can change quickly as market conditions evolve.
Summary – Silver price 2026
- Silver (XAG) trades at $85.97/oz as of 10:57am UTC on 4 March 2026, up approximately 18.4% year to date and around 169% year on year.
- Technical indicators place the 14-day RSI at 51.1 in neutral territory, while the ADX at 20.9 suggests trend strength remains limited. The classic pivot at $83.98 marks near-term support.
- Key price drivers include geopolitical developments in the Middle East, movements in the US dollar and uncertainty surrounding Section 232 tariffs. Industrial demand from solar, electric vehicles and AI-related electronics remains an important structural factor, while substitution risks and shifts in global manufacturing activity could also influence future price dynamics.
Past performance is not a reliable indicator of future results.
FAQ
What is the silver price forecast?
Third-party forecasts for silver in 2026 vary widely. Consensus polls, such as the Reuters survey, place the annual average around $79.50/oz, while J.P. Morgan projects an average near $81/oz. More scenario-based views, including ratio-compression models, outline significantly higher potential ranges. These projections depend on factors such as industrial demand, US dollar movements, tariff policy and supply conditions. Forecasts are inherently uncertain and may change as market conditions evolve.
Could silver’s price go up or down?
Silver’s price can move in either direction, sometimes sharply. Industrial demand from sectors such as solar energy, electric vehicles and electronics may support prices, while a stronger US dollar or weaker manufacturing activity could weigh on them. Geopolitical developments and shifts in investor sentiment can also influence short-term volatility. Because silver’s market is smaller and less liquid than gold, price swings can be amplified in both rising and falling markets.
Should I invest in silver?
Whether to gain exposure to silver depends on your financial objectives, risk tolerance and broader portfolio strategy. Silver can act as both an industrial metal and a store of value, which means it may respond to economic growth trends as well as macroeconomic uncertainty. However, prices can be volatile, and losses are possible. You should consider your personal circumstances and, where appropriate, seek independent financial advice before making investment decisions.
Can I trade silver CFDs on Capital.com?
Yes, you can trade Silver CFDs on Capital.com. Trading commodity CFDs lets you speculate on price movements without owning the underlying asset and to take long or short positions. However, contracts for difference (CFDs) are traded on margin, and leverage amplifies both profits and losses. You should ensure you understand how CFD trading works, assess your risk tolerance, and recognise that losses can occur quickly.