Crude oil price forecast: Strait of Hormuz closure
US Crude Oil and Brent are global oil benchmarks whose 2026 prices have been shaped by the Strait of Hormuz closure, OPEC+ output changes and shifting demand forecasts. Past performance is not a reliable indicator of future results.
US Crude Oil (US Crude) is trading at $99.85 in afternoon trading on 18 May 2026, within an intraday range of $98.03–$104.04. Brent Crude Oil (Brent Crude)is at $105.29, with a session range of $104.02–$108.55, leaving the Brent–US crude spread at around $5.44. Past performance is not a reliable indicator of future results.
Prices remain elevated as the closure of the Strait of Hormuz, following the outbreak of the US-Iran conflict, continues to tighten global supply (BBC News, 3 May 2026). OPEC+ output fell by around 1.74 million barrels per day in April alone, while OPEC's May monthly report cut its 2026 global demand growth forecast to 1.17 million barrels per day, down from 1.38 million barrels per day previously, citing the conflict's impact on trade flows (LSE, 13 May 2026). The US Energy Information Administration (EIA) noted that the Brent–WTI spread widened to an average of $12/bbl in March 2026 due to Hormuz-related shipping disruptions and elevated US inventory levels, which have continued to cap WTI gains relative to the international benchmark (EIA, 7 April 2026). President Trump described Iran's latest peace proposal response as 'totally unacceptable,' keeping ceasefire prospects uncertain and sustaining a risk premium across crude benchmarks (CBS News via YouTube, 11 May 2026).
Crude oil: Hormuz closure shapes third-party forecasts
As of 18 May 2026, third-party crude oil predictions reflect a rapid reassessment of the supply outlook, driven primarily by the extended closure of the Strait of Hormuz and its cascading impact on global inventories. The following targets summarise leading institutional projections across both benchmarks.
EIA (April 2026 STEO revision)
The US Energy Information Administration raised its full-year 2026 Brent spot price forecast sharply to $96/bbl in its April Short-Term Energy Outlook, up from $78.84/bbl in the March edition, while revising WTI to $87.41/bbl from $73.61/bbl. The agency attributed the upward revision to the effective closure of the Strait of Hormuz following US and Israeli strikes on Iran, which it said adversely disrupted global energy supply chains (Rigzone, 14 April 2026).
Goldman Sachs (Q4 2026 revised deck)
Goldman Sachs raised its Q4 2026 Brent forecast to $90/bbl and its Q4 2026 WTI forecast to $83/bbl, lifting both from prior estimates of $83/bbl and $78/bbl respectively. The bank cited 14.5 million barrels per day of Middle Eastern output losses driving a record inventory drawdown, and pushed back its expectation for Strait of Hormuz normalisation to end-June from mid-May (Reuters, 26 April 2026).
Barclays (2026 annual forecast lift)
Barclays raised its full-year 2026 Brent crude forecast to $100/bbl from $85/bb, citing the ongoing impasse in the Strait of Hormuz and a supply deficit the bank estimated at approximately 6.6 million barrels per day. The bank noted that forward-implied average Brent prices for 2026 stood near $94/bbl, and added that if disruptions persisted through end-May, prices could reprice toward $110/bbl (Global Banking and Finance, 1 May 2026).
Morgan Stanley (Q2–Q3 2026 standing targets)
Morgan Stanley left its Brent crude forecasts unchanged, maintaining a Q2 2026 target of $110/bbl and a Q3 2026 target of $100/bbl, with the bank projecting prices to fall to $80/bbl in 2027. The bank said it expected oil supply chains to take months to normalise even if a Strait of Hormuz reopening were achieved, pointing to a structurally slow recovery in Gulf production capacity (Energy Now, 14 April 2026).
HSBC (2026 annual Brent revision)
HSBC raised its 2026 average Brent price forecast to $95/bbl, citing a longer effective closure of the Strait of Hormuz than the bank had previously modelled. The revision, published in the week of 12 May, placed HSBC's annual Brent average broadly in line with the EIA's April STEO figure of $96/bbl, with both institutions pointing to sustained supply disruption as the dominant driver (Reuters, 13 March 2026).
J.P. Morgan (first revised deck since March)
J.P. Morgan published its first revised oil price forecasts in two months, projecting the Brent spot price to average $96/bbl for full-year 2026 and $75/bbl in 2027, with WTI averaging $89/bbl in 2026 and $70/bbl in 2027. Head of global commodities strategy Natasha Kaneva and colleagues revised the prior $60/bbl Brent baseline substantially higher, reflecting the structural impact of Hormuz-related supply losses on the global oil balance (Rigzone, 13 May 2026).
Predictions and third-party forecasts are inherently uncertain, as they cannot fully account for unexpected market developments. Past performance is not a reliable indicator of future results.
Crude oil prices: Technical overview
To the upside, the Classic R1 at $122.14 is the first pivot reference in view; a convincing daily close above that level may shift technical focus toward R2 $139.22. On the downside, the Classic Pivot at $100.56 provides the initial nearby reference, with the 20-day SMA at $99.01 sitting just below the current price. A move below the 50-day SMA shelf near $97.21 could risk a deeper retracement toward S1 at $83.48 (TradingView, 18 May 2026).
To the upside, the Classic R1 at $121.37 is the nearest pivot reference; a daily close above that level may shift technical focus toward R2 $132.34. On the downside, the Classic Pivot at $103.73 is the first support reference, followed by the 30-day SMA shelf near $102.55. A break below the 20-day SMA at $105.35 would need confirmation before the pivot level is tested, while a daily close below $103.73 could risk a move toward S1 at $92.76 (TradingView, 18 May 2026).
The following technical analysis is provided for informational purposes only and does not constitute financial advice or a recommendation to buy or sell any instrument.
Crude oil price history (2024–2026)
US Crude Oil (WTI)
The US Crude price opened 2024 around $71.70 and spent much of the year trading in a broad $55–$83 range, reaching a local high near $83.52 on 5 July 2024 before drifting lower into year-end. The benchmark closed 2024 at around $57.35, weighed down by global oversupply concerns and a subdued demand outlook.
2025 was similarly subdued. WTI spent the first half range-bound between roughly $55 and $79, dipping to a multi-year low near $54.86 on 9 April 2025 during a bout of macro-driven selling, before recovering into the $60–$70 band through the second half. The year ended near $57.35.
The picture changed sharply in 2026. WTI rose from early-year lows near $56.24 on 8 January to a near-term high of $115.78 on 9 March amid the US-Iran conflict, before a volatile pullback toward $76.10 on 10 March. Prices then rebounded to trade near $99.94 as of 18 May 2026 – around 74% above the January 2026 open and 60.5% higher year on year.
Past performance is not a reliable indicator of future results. Prices are indicative and may differ from live market prices.
Brent Crude Oil
The Brent Crude price began 2024 around $74.82 and traded broadly between $70 and $82 through the first half of the year, touching a local peak near $82.46 on 5 July 2024 before declining through the back half. The benchmark closed 2024 at $74.82, broadly flat on the year.
2025 was mixed. Brent traded within a $60–$80 range for most of the year, dipping to a low of $54.86 on 9 April 2025 amid tariff-related demand fears, before recovering back into the mid-$60s through summer and autumn. The year closed near $60.92.
2026 has been the most significant period. Brent moved sharply higher from a January 2026 open near $60.75 to $116.29 on 9 March – its highest level since the 2022 energy crisis – as the Strait of Hormuz closure tightened global supply. After a volatile pullback toward $80.33 on 10 March, prices recovered to trade near $105.38 as of 18 May 2026 – around 73% above the January 2026 open and 63.5% higher year on year.
US Crude vs Brent Crude: Capital.com analyst outlook
The crude oil market has undergone a substantial repricing in 2026, with both WTI and Brent trading well above their 2024–2025 ranges following the effective closure of the Strait of Hormuz and the associated loss of a significant portion of global seaborne supply. WTI has risen from below $60 at the start of the year to trade near $99.85 as of 18 May 2026, while Brent has climbed to around $105.29 over the same period, reflecting a sustained geopolitical risk premium across both benchmarks. That said, these levels could prove fragile. Any credible progress toward a ceasefire or the reopening of the Strait could lead to a sharp reversal, as the structural oversupply backdrop that characterised 2025 – when OPEC+ was already managing excess production – could reassert itself quickly if flows normalise.
Looking further ahead, the demand picture adds another layer of complexity. Elevated prices may dampen demand over time, encourage fuel switching and accelerate the energy transition in import-dependent economies, which could limit further upside. On the other hand, supply disruption that outlasts initial market assumptions could draw inventories down further, potentially providing renewed support. The extent to which OPEC+ members fill any supply gap, and whether non-OPEC producers can meaningfully raise output, will be key variables in either direction. The upside and downside cases both remain credible, leaving the range of plausible outcomes unusually wide.
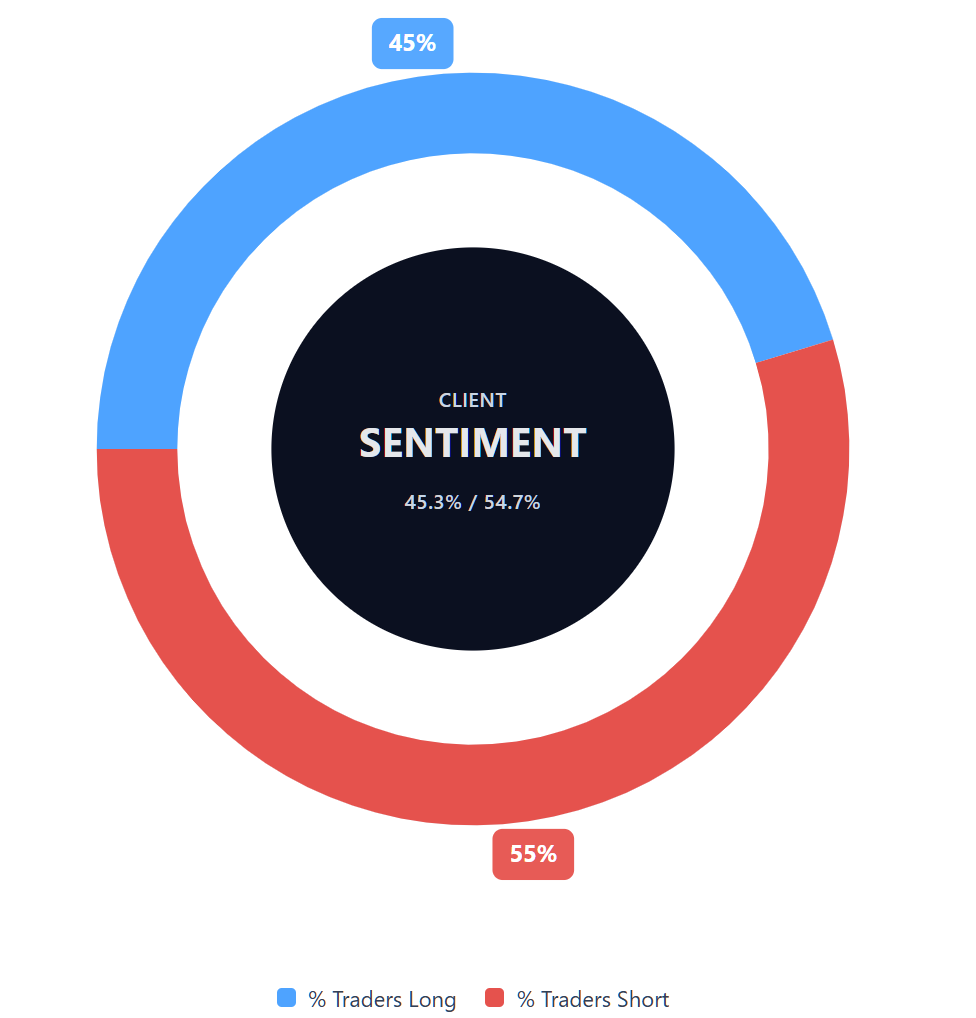
Capital.com’s client sentiment for US Crude CFDs
As of 18 May 2026, Capital.com client positioning in US Crude CFDs shows 45.3% buyers vs 54.7% sellers, putting sellers ahead by 9.4 percentage points and placing current sentiment in slight short-bias territory. This snapshot reflects open positions on Capital.com and can change.
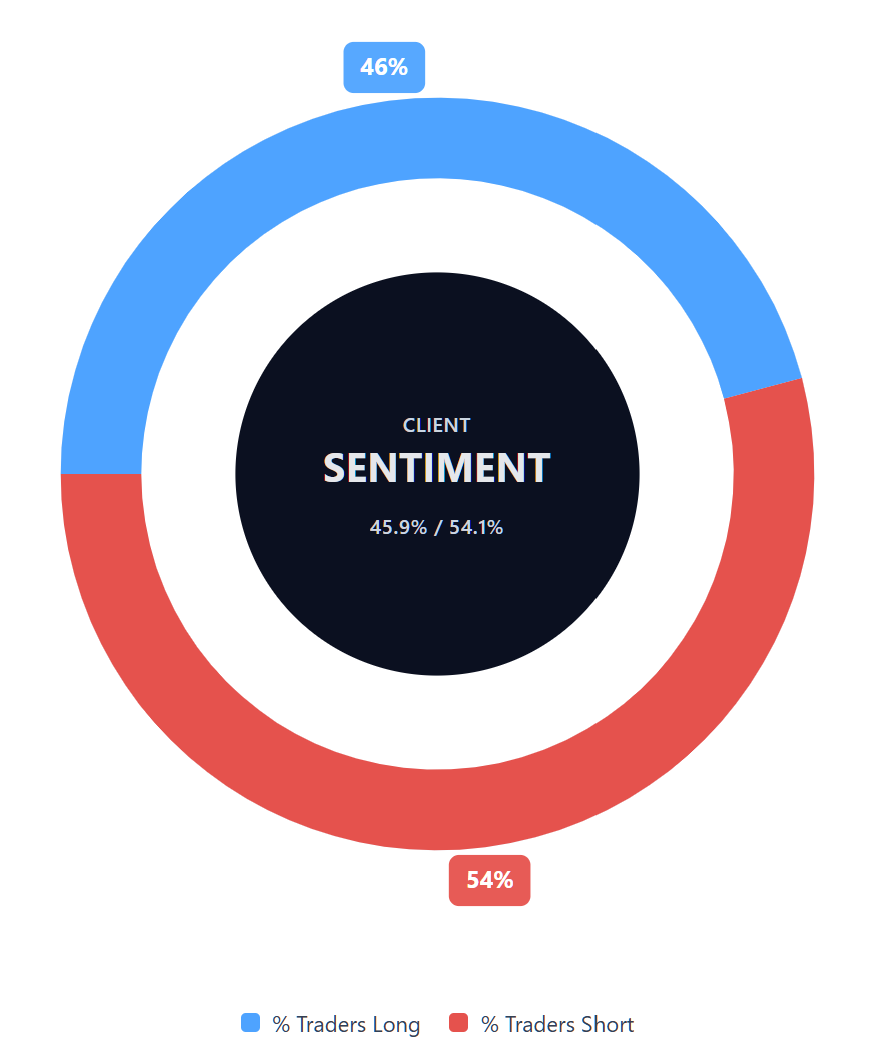
Capital.com’s client sentiment for Brent Crude CFDs
As of 18 May 2026, Capital.com client positioning in Brent Crude CFDs shows 45.9% buyers vs 54.1% sellers, putting sellers ahead by 8.2 percentage points and also placing sentiment in slight short-bias territory. This snapshot reflects open positions on Capital.com and can change.
Summary – US Crude and Brent Crude (2026)
- WTI trades at $99.85 and Brent at $105.29 as of 2:40pm UTC on 18 May 2026, with both benchmarks up roughly 60–74% year on year from early 2026 lows.
- Technical indicators show both benchmarks holding above their full moving-average stacks, with neutral RSI readings of 52.09 for WTI and 54.62 for Brent. Weak ADX readings indicate that neither market has a firmly established directional trend.
- The Strait of Hormuz closure remains the dominant price driver, with an estimated loss of 14.5 million barrels per day of Middle Eastern output underpinning the geopolitical risk premium.
- Institutional 2026 forecasts range widely, from Goldman Sachs at $90/bbl for Q4 Brent to Morgan Stanley at $110/bbl for Q2 Brent, reflecting divergent assumptions on when supply normalises.
- OPEC cut its 2026 global demand growth forecast to 1.17 million barrels per day in May, while Barclays lifted its annual Brent target to $100/bbl and HSBC raised its average to $95/bbl.
Past performance is not a reliable indicator of future results.
FAQ
What is the crude oil price forecast?
Crude oil price forecasts vary by institution, reflecting different assumptions about supply disruption, demand growth and when the Strait of Hormuz could normalise. Recent 2026 Brent forecasts in the article cluster around $90–$100/bbl, while WTI forecasts sit slightly lower, reflecting the ongoing Brent–WTI spread. These projections are not guaranteed. Oil prices can move quickly if geopolitical risks ease, inventories shift, or demand expectations change.
Could crude oil’s price go up or down?
Crude oil prices could move in either direction. Prices may rise if supply disruption persists, inventories draw down further, or geopolitical risk remains elevated. They may fall if ceasefire talks progress, the Strait of Hormuz reopens, or higher prices weigh on demand. OPEC+ output decisions, non-OPEC supply and macroeconomic conditions could also influence both WTI and Brent. This makes the outlook unusually wide and sensitive to new information.
Should I invest in crude oil?
Whether crude oil is suitable for you depends on your goals, risk tolerance and market knowledge. Crude oil can be volatile, and CFD trading adds further risk because leverage can magnify both gains and losses. Before trading, consider how oil fits within your wider strategy, whether you understand the drivers of WTI and Brent prices, and how you would manage risk. This article is informational only and doesn’t constitute financial advice.
Can I trade crude oil CFDs on Capital.com?
Yes, you can trade US Crude CFDs and Brent Crude CFDs on Capital.com. Trading commodity CFDs lets you speculate on price movements without owning the underlying asset and to take long or short positions. However, contracts for difference (CFDs) are traded on margin, and leverage amplifies both profits and losses. You should ensure you understand how CFD trading works, assess your risk tolerance, and recognise that losses can occur quickly.