Gold price forecast: Fed cut doubts, firmer dollar
Gold traded near $4,700 on 27 April 2026 after last week’s sell-off, with a firmer US dollar and reduced Fed cut expectations offsetting continued central bank demand. Explore third-party Gold price targets and technical analysis. Past performance is not a reliable indicator of future results.
Gold (XAU/USD) is trading at $4,692.71 on Capital.com's quote feed as of 3:12pm UTC on 27 April 2026, within an intraday range of $4,659.54–$4,728.64. Past performance is not a reliable indicator of future results.
The pullback reflects several converging pressures. US–Iran tensions resurfaced after Trump withdrew key officials from peace talks in Islamabad, briefly weighing on safe-haven demand that had supported the earlier rally, while a firmer US Dollar Index, cited near 98.51, has capped any sharp recovery (Share Talk, 27 April 2026). Fading Federal Reserve rate-cut expectations have added another headwind, with markets pricing in only a limited probability of easing at the 28–29 April Fed meeting amid sticky inflation, partly driven by elevated oil prices linked to the Hormuz blockade (Reuters, 24 April 2026). Underlying support has come from continued central bank demand: the People's Bank of China reported its 17th consecutive monthly gold purchase in March 2026, adding 5 tonnes to bring holdings to 2,313 tonnes, equivalent to 9% of total foreign reserves (World Gold Council, 14 April 2026).
Gold price outlook: Fed doubts build as bank targets diverge
As of 27 April 2026, third-party gold predictions reflect a broadly constructive institutional consensus, shaped by central bank accumulation, de-dollarisation trends, ETF inflows, and persistent geopolitical uncertainty.
Morgan Stanley (H2 2026 revised target)
Morgan Stanley has revised its H2 2026 gold price forecast to $5,200/oz, trimmed from a prior estimate of $5,700/oz, citing a difficult six-week decline that reshaped near-term market dynamics. The bank points to three headwinds: a slowdown in official-sector purchasing, with central banks averaging roughly 31 tonnes per month in January and February versus 50 tonnes per month across 2025; a reversal in ETF flows, with funds selling about 90 tonnes in March after buying 150 tonnes in January and February; and a technical break below the 50-day and 100-day moving averages that triggered systematic selling. Even so, structural support from central bank demand, currency debasement concerns, and geopolitics remains intact, with the bank projecting two 25-basis-point Fed cuts in September and December (TheStreet, 22 April 2026).
Reuters (quarterly analyst poll)
The April 2026 Reuters quarterly poll of 31 analysts and traders returned a median annual average forecast of $4,916/oz for 2026, up from the $4,746.50 median in the February survey and the highest annual consensus in Reuters polling history since 2012. The revision higher reflects sustained haven demand tied to the ongoing US–Iran conflict and continued official-sector accumulation, with the poll noting that gold's structural drivers remain intact despite the sharp March correction (Reuters, 27 April 2026).
Goldman Sachs (year-end 2026 reaffirmation)
Goldman Sachs reaffirms its year-end 2026 target of $5,400/oz, set by analysts Daan Struyven and Lina Thomas in January, leaving the call unchanged after gold's more than 10% decline in March, its sharpest monthly drop since June 2013. The bank bases its view on central bank purchases of about 60 tonnes per month, continued Western ETF inflows of roughly 500 tonnes since early 2025, and what it terms the structural "debasement trade" among long-duration institutional buyers, while noting that risks remain tilted to the upside (Investing.com, 31 March 2026).
J.P. Morgan (year-end 2026 maintained)
J.P. Morgan holds the most bullish major-bank call at $6,300/oz by year-end 2026, maintained from its February revision, alongside a long-term equilibrium price of $4,500/oz and a structural price floor of $4,400–$4,600/oz. The bank projects central banks will buy around 800 tonnes in 2026, with the structural demand thesis built on continued official-sector and investor accumulation plus further ETF inflows, described as not yet exhausted (Reuters, 25 February 2026).
Predictions and third-party forecasts are inherently uncertain, as they cannot fully account for unexpected market developments. Past performance is not a reliable indicator of future results.
Gold price: Technical overview
Gold spot trades at $4,692.71 as of 3:12pm UTC on 27 April 2026, sitting below the short-term simple moving average cluster, with the 20-, 50- and 100-day SMAs at roughly $4,729, $4,863, and $4,746. That leaves the price below the band, according to TradingView data. The 200-day SMA at $4,253 remains well below current levels and provides a longer-term structural reference.
Momentum is mixed to soft. The 14-day relative strength index reads 45.3, placing it in neutral territory with a slight downward bias, while the average directional index at 19.9 suggests the prevailing trend lacks strong conviction in either direction (TradingView).
On the topside, the classic R1 pivot at $5,359 marks the nearest upside reference, though a daily close above the $4,729–$4,746 SMA cluster would be needed before that level comes into clearer focus. The classic pivot point sits at $4,729, broadly in line with the intraday session high of $4,728.64 from the Capital.com feed, which may act as near-term resistance.
To the downside, initial support rests at the S1 pivot near $4,038, with the 100-day exponential moving average at $4,660, diverging from the 100-day SMA by roughly 2%, offering a closer intervening shelf. A slip beneath that level could open the way towards S1 (TradingView, 27 April 2026).
This is technical analysis for informational purposes only and does not constitute financial advice or a recommendation to buy or sell any instrument.
Gold price history (2024–2026)
The gold spot price ended April 2024 near $2,336/oz, having already gained strongly through the first quarter on central bank demand and expectations of US rate cuts. The metal then moved broadly sideways through the summer, ranging between roughly $2,294 and $2,531, before an October 2025 surge carried it above $4,000/oz for the first time, driven by US–China trade tensions, easing monetary policy bets, and sustained official-sector accumulation.
The rally extended sharply into the new year. Gold hit an all-time high of $5,589.38/oz on 28 January 2026, propelled by geopolitical uncertainty, safe-haven inflows, and what Reuters described as a historic 64% annual gain in 2025, the metal's strongest yearly performance since 1979. The move then reversed sharply: March 2026 brought gold's steepest monthly decline since 2013, with prices falling roughly 12% to around $4,098/oz at their low, as a stronger US dollar, rising Treasury yields, ETF outflows, and profit-taking triggered a broad liquidation of positions.
Gold has since recovered partially, closing at $4,692.92 on 27 April 2026, approximately 16.1% below the January all-time high, but roughly 100.3% above its level on 28 April 2024 ($2,336.23).
Past performance is not a reliable indicator of future results. Prices are indicative and may differ from live market prices.
Gold price outlook: Capital.com analysis
Gold spot (XAU) has delivered a notable two-year run, rising from around $2,290/oz in April 2024 to an all-time high of $5,589.38 on 28 January 2026, before a sharp correction brought prices back to the $4,600–$4,900 range where they now trade. That correction, the metal's steepest monthly decline in more than a decade, shows that elevated prices carry two-sided risk: the same safe-haven and de-dollarisation flows that supported the rally can reverse quickly if geopolitical tensions ease, the US dollar strengthens, or ETF holders liquidate positions into rising real yields.
Several structural themes continue to support the market. Central bank purchases remain a consistent source of demand, and persistent uncertainty around US trade policy, the US–Iran conflict, and fiscal sustainability has kept investor appetite for real assets elevated. At the same time, gold offers no yield, so any credible shift towards tighter global monetary conditions could weigh on prices even if broader risk factors remain in place. Both the supportive macro backdrop and the potential headwinds from a stronger dollar or weaker haven demand deserve consideration when assessing the broader market outlook.
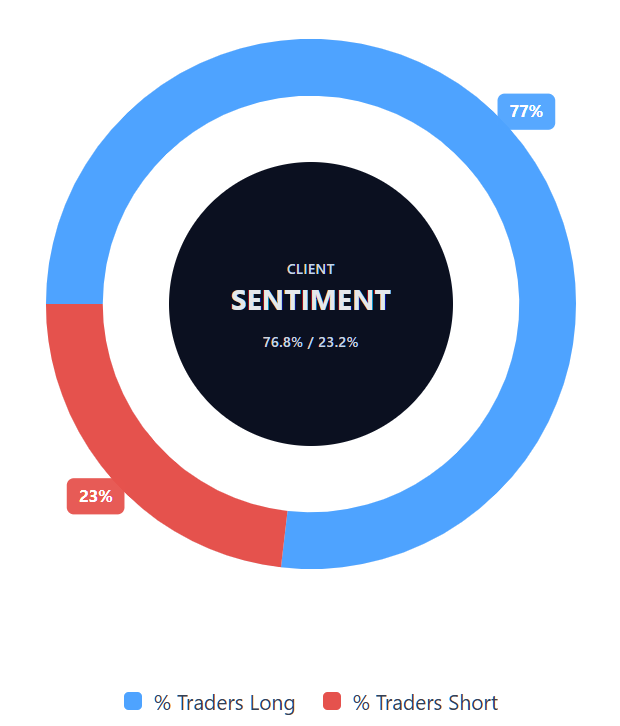
Capital.com’s client sentiment for Gold CFDs
As of 27 April 2026, Capital.com client positioning in Gold spot CFDs stands at 76.8% buyers versus 23.2% sellers, putting buyers ahead by 53.6 percentage points and placing sentiment firmly in one-sided long territory. This snapshot reflects open positions on Capital.com and can change rapidly as market conditions evolve.
Summary – Gold price 2026
- Gold spot (XAU) trades at $4,692.71 as of 3:12pm UTC on 27 April 2026, roughly 100% above its April 2024 level near $2,336/oz and approximately 16% below the all-time high of $5,589.38 set on 28 January 2026.
- Key upside drivers include persistent central bank accumulation, with the People's Bank of China extending its buying streak to 17 consecutive months in March 2026, alongside de-dollarisation flows and haven demand linked to the US–Iran conflict.
- A hawkish Federal Reserve at the 28–29 April meeting, a firmer US dollar, and oil-driven inflation concerns remain the main near-term headwinds weighing on prices.
Past performance is not a reliable indicator of future results.
FAQ
What is the Gold price forecast?
Could Gold’s price go up or down?
Gold’s price could move in either direction, depending on how economic and geopolitical conditions develop. Continued central bank buying, haven demand, and ongoing uncertainty may support prices. However, a firmer US dollar, reduced expectations for Federal Reserve rate cuts, rising real yields, or weaker ETF demand could weigh on the market. Because these drivers can change quickly, gold may remain volatile, particularly over shorter timeframes and around major policy or geopolitical events.
Should I invest in Gold?
Whether gold is appropriate for you depends on your financial goals, risk tolerance, time horizon, and preferred type of market exposure. The article is intended for general information only and does not provide investment advice or a recommendation. Gold may appeal to some market participants during periods of uncertainty, but it can also fall sharply and does not produce yield. Any decision should take into account both the potential benefits and the risks involved.
Can I trade Gold CFDs on Capital.com?
Yes, you can trade Gold CFDs on Capital.com. Trading commodity CFDs lets you speculate on price movements without owning the underlying asset and to take long or short positions. However, contracts for difference (CFDs) are traded on margin, and leverage amplifies both profits and losses. You should ensure you understand how CFD trading works, assess your risk tolerance, and recognise that losses can occur quickly.