Silver price forecast: Dollar softness and truce developments
Silver spot traded at $76.34/oz on 2 June 2026, with US dollar softness, US-Iran truce developments and solar demand in focus. Explore third-party Silver price targets and technical analysis. Past performance is not a reliable indicator of future results.
Silver (XAG) is trading at $76.34 per troy ounce as of 10:30am UTC on 2 June 2026, within an intraday range of $74.30–$76.90. Past performance is not a reliable indicator of future results.
Support for silver appears to come from US dollar softness, with the DXY hovering near 99 on 2 June 2026 (Trading Economics, 2 June 2026), and a broader risk tone shaped by ongoing US-Iran truce developments. July silver futures opened at $76.02 on 29 May after a truce extension was reported, gaining 4.6% from the prior session (Yahoo Finance, 29 May 2026). Structural industrial demand also remains in focus, as global solar PV capacity expansion continues to underpin silver consumption, even as photovoltaic manufacturers accelerate efforts to reduce silver intensity amid elevated prices (PV Magazine, 15 April 2026). Silver has gained approximately 122% over the past year, according to data published on 2 June 2026 (Trading Economics, 2 June 2026).
Silver: US dollar and truce talks frame third-party targets
As of 2 June 2026, third-party Silver predictions reflect diverging views shaped by the metal's pullback from its January 2026 all-time high near $116/oz. Federal Reserve rate expectations, Middle East tensions, and structural industrial demand remain the most frequently cited swing factors.
UBS (revised quarterly targets)
UBS cut its silver price forecasts across all key horizons, projecting June-end silver at $85/oz, down from a prior $100/oz target; September-end at $85/oz, from $95/oz; and December-end at $80/oz, from $85/oz. It also set a March 2027 target of $75/oz, down from $85/oz. The bank cites subdued investment demand, weaker industrial usage, and rising mine supply as the primary drivers behind the downward revisions, with spot silver trading around $73.80/oz at the time of publication (Economy Middle East, 1 May 2026).
Goldman Sachs (strategic metals view)
Goldman Sachs maintains a 2026 annual average target of $85–$100/oz for silver, viewing the metal as the primary strategic commodity of the green energy transition. The bank flags persistently thin silver inventories as a key amplifier of volatility, noting that prices remain highly sensitive to flow shifts amid constrained above-ground supply, as reported across institutional trackers in late May 2026 (Kavout, 30 May 2026).
Ridgemont Metals (June range)
Deric Ned, founder and CEO of Ridgemont Metals, expects silver to trade between $72/oz and $88/oz in June 2026, with a base case of $80–$85/oz. Ned notes that silver could retest $90/oz if Middle East tensions ease and the US dollar weakens, while a hawkish Federal Reserve pivot would bring $70/oz into view. He adds that solar and AI infrastructure demand provides a structural floor, although this remains a third-party view rather than a certainty (CBS News, 28 May 2026).
APMEX (June range)
Brett Elliott, director of marketing at APMEX, puts the June 2026 silver range at $60–$100/oz, with the bulk of price action expected between $70/oz and $90/oz. Elliott notes that silver is being pulled in opposing directions, with cooling investment demand weighing on price while a persistent, if shrinking, supply deficit continues to provide underlying support (CBS News, 28 May 2026).
DailyForex (technical range view)
DailyForex technical analysis identifies a near-term trading range of $70–$80/oz for silver, with the 50-day EMA acting as overhead resistance and potentially capping recovery attempts. The analysis notes that a broader consolidation zone between $70/oz and $90/oz remains intact, as elevated US rates and Middle East risk factors limit directional momentum (DailyForex, 28 May 2026).
Predictions and third-party forecasts are inherently uncertain, as they cannot fully account for unexpected market developments. Past performance is not a reliable indicator of future results.
Silver spot: key macro events and data
Macro conditions as of early June 2026 remain a primary influence on silver spot pricing, with US monetary policy, dollar dynamics, and geopolitical developments the most active near-term drivers.
The US Dollar Index (DXY) is hovering near 99 as of 2 June 2026, having eased marginally from the prior session's close of 99.06 (Trading Economics, 2 June 2026). That move has kept attention on dollar-denominated commodities including silver. Federal Reserve policy remains in focus after the May US manufacturing PMI rose 1.3 points to 54.0, beating expectations of a 0.3-point rise to 53.0 (Barchart, 26 May 2026). That reading supported a cautious Fed stance and weighed on rate-cut expectations heading into June.
Geopolitical developments continue to interact with silver's safe-haven and industrial price dynamics. Silver futures opened sharply higher on 29 May 2026, gaining 4.6% from Thursday's open to $76.02/oz, after news of a US-Iran truce extension reduced tail-risk concerns (Yahoo Finance, 29 May 2026). The move showed how quickly geopolitical headlines can affect short-term positioning in the silver market. On the industrial side, silver demand from the photovoltaic (PV) sector is forecast to fall approximately 19% in 2026 to around 151 million ounces, as solar panel manufacturers accelerate efforts to reduce silver paste intensity amid elevated prices (PV Magazine, 15 April 2026). Analysts note that this structural shift could weigh on one of silver's largest end-use demand channels over the medium term.
Silver price: technical overview
Silver CFDs trade at $76.34 as of 10:30am UTC on 2 June 2026, sitting below its 20/50/100/200-day simple moving averages at roughly $78, $76, $81 and $66. The 20-day SMA at $78.06 trades above the 50-day SMA at $75.90, leaving the 20-over-50 alignment nominally intact, though price is currently beneath both levels. The 14-day relative strength index (RSI) reads 48.85, a neutral reading that reflects neither overbought nor oversold conditions. The average directional index (ADX) at 15.06 sits just above the threshold commonly associated with a weak or non-trending environment, per TradingView data.
On the topside, the classic pivot point (P) at $78.82 represents the first reference above current price. A daily close through that level would bring R1 at $85.83 into view, while R2 at $96.39 remains a more distant reference.
On the downside, the S1 classic pivot at $68.26 is the next structured support level below current price. The 200-day SMA at $66.35 represents the deeper MA shelf, while the 200-day exponential moving average (EMA) at $67.63 sits nearby. Together, they form a cluster in the $66–$68 area that could act as a broader support zone if price were to extend lower (TradingView, 2 June 2026).
This is technical analysis for informational purposes only and does not constitute financial advice or a recommendation to buy or sell any instrument.
Silver price history (2024–2026)
The Silver spot price opened June 2024 trading near $30.75/oz, consolidating after a strong spring rally. Prices drifted lower through the summer, slipping to around $26.52/oz on 5 August 2024 amid a sharp global equity sell-off, before recovering to close the year at $28.91/oz on 31 December 2024.
2025 was a year of steady accumulation. Silver spent the first half rangebound between $29/oz and $34/oz, with a US-China trade truce in May helping lift sentiment and push prices toward $33.50/oz by late May. The metal closed 2025 at roughly $71.64/oz on 31 December, having accelerated sharply in the final months of the year amid mounting supply deficit concerns and a weaker US dollar.
The move extended dramatically into early 2026. Silver reached a nominal all-time high of $121.69/oz on 29 January 2026, driven by thin LBMA inventory levels, industrial demand from the solar and AI infrastructure buildout, and a surge in speculative positioning. The price then fell roughly 30% within 24 hours, closing 30 January at $85.29/oz as profit-taking and margin calls triggered a disorderly unwind. Silver attempted to reclaim $90/oz in March 2026, peaking near $90.06/oz on 10 March, before retreating again to the mid-$70s through April and May.
Silver spot (XAG) closed at $76.35/oz on 2 June 2026, approximately 5.0% up year to date and 119.8% up year on year.
Past performance is not a reliable indicator of future results. Prices are indicative and may differ from live market prices.
Silver price outlook: Capital.com analysis
Silver Spot's performance over the past year has been exceptional by historical standards, rising more than 119% year on year to trade near $76.34/oz as of 2 June 2026. The metal's dual identity as both a monetary asset and an industrial commodity has drawn broad interest, with a structural supply deficit, now in its sixth consecutive year and estimated at 65m–70m ounces in 2026, providing a fundamental underpinning. Demand from solar, EV, and AI infrastructure sectors continues to support consumption, though photovoltaic manufacturers are actively accelerating efforts to reduce silver content per panel. That could erode one of the metal's most significant demand pillars over the medium term.
From a macro perspective, US dollar softness and Fed rate expectations have historically amplified silver's upside; a reversal in either could equally accelerate selling pressure. The extreme volatility evident in January 2026, when prices hit a nominal all-time high near $121.69/oz before shedding roughly 30% in a single session, illustrates how quickly sentiment can shift in a market characterised by thin inventories and leveraged positioning. Silver's wider trading range relative to gold means it can move sharply in either direction as macro conditions evolve.
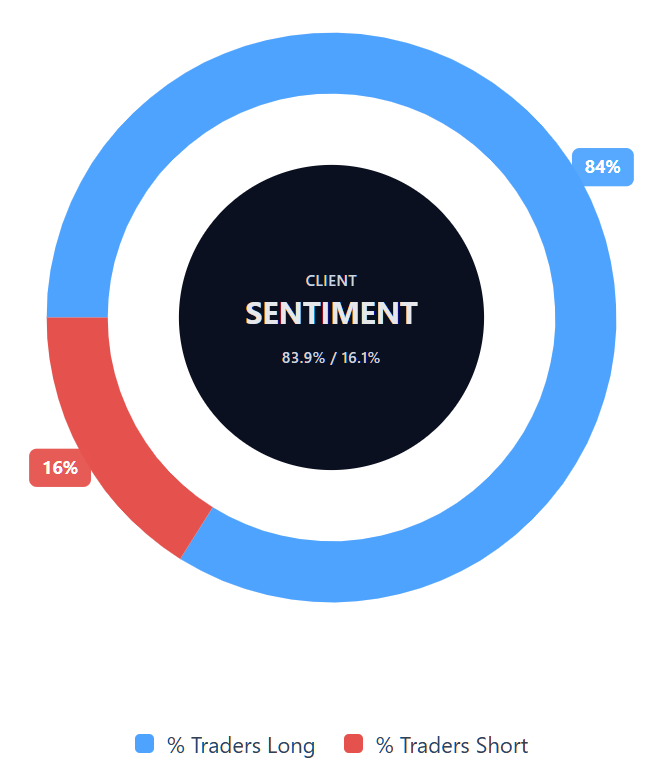
Capital.com’s client sentiment for Silver CFDs
As of 2 June 2026, Capital.com client positioning in Silver spot CFDs stands at 83.9% buyers and 16.1% sellers, putting buyers ahead by 67.8 percentage points. This indicates a one-sided tilt towards long positions among Capital.com clients at the time of the snapshot. This snapshot reflects open positions on Capital.com and can change.
Summary – Silver price 2026
- Silver spot (XAG/USD) trades at $76.34 as of 10:30am UTC on 2 June 2026, up approximately 5.0% year to date and 119.8% year on year.
- Key price drivers include a sixth consecutive annual silver supply deficit, Fed rate expectations, US dollar direction, and structural industrial demand from solar and AI infrastructure.
- Photovoltaic manufacturers are actively reducing silver intensity per panel, a medium-term demand headwind that could weigh on one of silver's largest consumption channels.
- A US-Iran truce extension lifted silver futures 4.6% on 29 May 2026, illustrating the metal's ongoing sensitivity to geopolitical developments alongside macro data.
Past performance is not a reliable indicator of future results.
FAQ
What is the Silver price forecast?
Could Silver’s price go up or down?
Should I invest in Silver?
Can I trade Silver CFDs on Capital.com?
Yes, you can trade Silver CFDs on Capital.com. Trading commodity CFDs lets you speculate on price movements without owning the underlying asset and to take long or short positions. However, contracts for difference (CFDs) are traded on margin, and leverage amplifies both profits and losses. You should ensure you understand how CFD trading works, assess your risk tolerance, and recognise that losses can occur quickly.