
Crude oil price forecast: US–Iran talks and OPEC+ supply
US Crude and Brent Crude fell after US–Iran talks eased supply concerns and OPEC+ agreed to raise output quotas by 188,000 barrels per day from August. Explore third-party crude oiL price targets and technical analysis. Past performance is not a reliable indicator of future results.
As of 9.50am UTC on 28 July 2026 US Crude Oil (US Crude) traded near $79.90 in early European hours on Tuesday, within an intraday range of $79.29–$84.16. Brent Crude Oil (Brent Crude) was higher at $83.59, within a range of $82.75–$88.40. Past performance is not a reliable indicator of future results.
The pullback followed easing supply concerns after President Trump said the US was having 'good talks' with Iran (Reuters, 21 June 2026). The comments weighed on Brent and other crude benchmarks during early Asian and European trading, with WTI trading near $71 a barrel and Brent near $76 a barrel amid the easing tensions (World Oil, 10 July 2026). Prices also came under pressure after OPEC+ decided to raise output quotas by 188,000 barrels per day from August, adding to global supply and marking the fifth consecutive monthly increase as the group continues to unwind earlier production cuts (Reuters, 5 July 2026). Shipping flows through the Strait of Hormuz remain another important influence on sentiment, with weekly transit data showing sharp swings as security conditions fluctuate (Lloyd's List Intelligence, 21 July 2026).
Third-party oil outlook: US–Iran talks, supply concerns
As of 28 July 2026, third-party crude oil predictions point to a wide range of possible outcomes for both benchmarks. The outlook depends largely on the pace of shipping normalisation through the Strait of Hormuz, future OPEC+ supply increases and changes in global demand.
The following summaries cover third-party price targets published during this period, split evenly between US Crude and Brent Crude.
Goldman Sachs (research note, US Crude)
Goldman Sachs forecasts WTI crude to average $52 per barrel in 2026, placing it at the lower end of the institutional forecasts reviewed. The bank attributes the revision to a persistent global surplus of 2 million barrels per day, as non-OPEC production continues to outpace demand growth (Intellectia, 11 July 2026).
LiteFinance (technical forecast, US Crude)
LiteFinance places US Crude within a forecast range of $51.99–$76.79 per barrel for July 2026, with the contract quoted at $68.29 on 6 July 2026. The firm cites shifting support and resistance levels, geopolitical tensions and lower midsummer trading volumes as the basis for the range (LiteFinance, 16 July 2026).
EIA Short-Term Energy Outlook (federal forecast, Brent Crude)
The US Energy Information Administration's July Short-Term Energy Outlook projects that Brent crude will average $81.91 per barrel in 2026 and $64.76 in 2027. These forecasts are down from its June estimates of $95.39 and $79.39, respectively. The agency attributes the downgrade to a faster-than-expected recovery in tanker traffic through the Strait of Hormuz following the 18 June memorandum of understanding between the US and Iran (Rigzone, 9 July 2026).
J.P. Morgan Global Research (house view, Brent Crude)
J.P. Morgan Global Research forecasts that Brent crude will average $86 per barrel in the third quarter of 2026, before easing to $80 in the fourth quarter and $78 by year-end. The bank cites weaker supply-and-demand fundamentals and an assumed continuation of measured OPEC+ output increases as factors behind the projected decline (J.P. Morgan, 16 July 2026).
S&P Global Market Intelligence (commodity outlook, Brent Crude)
S&P Global Market Intelligence revised its average 2026 Brent crude forecast to $87 per barrel, down from $103 previously. The research house cites an uneasy ceasefire in the Middle East, which has allowed prices to partially retreat from second-quarter peaks. It adds that the outlook remains vulnerable to the fragile ceasefire and the potential for renewed disruption in the Strait of Hormuz (S&P Global, 17 July 2026).
Predictions and third-party forecasts are inherently uncertain, as they cannot fully account for unexpected market developments. Past performance is not a reliable indicator of future results.
Crude oil prices: technical overview
US Crude Oil (WTI)
As of 9.50am UTC on 28 July 2026, US Crude’s price trades around or below several key moving averages. The 20-, 50-, 100- and 200-day moving averages stand at approximately $78, $83, $90 and $75, respectively, leaving the near-term technical picture mixed.
The 20-day simple moving average (SMA) remains below the 50-day SMA, meaning the averages do not indicate bullish alignment. The 14-day relative strength index (RSI) is near 50, suggesting broadly neutral momentum. Meanwhile, the 14-day average directional index (ADX) stands at 28, indicating moderate trend strength without showing its direction.
On the upside, the first area to watch is the R1 pivot near $88. A daily close above this level could bring the R2 marker near $107 into view. On pullbacks, initial support sits near the classic pivot at $78, followed by the 200-day SMA at approximately $75. A sustained move below this level could shift attention towards the S2 area near $50 (TradingView, 28 July 2026).
This technical analysis is for informational purposes only and does not constitute financial advice or a recommendation to buy or sell any instrument.
Brent Crude Oil
As of 9.50am UTC on 28 July 2026, Brent Crude’s price trades around or below several key moving averages. The 20-, 50-, 100- and 200-day moving averages stand at approximately $83, $86, $94 and $80, respectively, offering no clear bullish signal.
The 20-day SMA remains below the 50-day SMA, while the 14-day RSI is near 48, indicating broadly neutral to slightly weaker momentum. The 14-day ADX stands at 34, suggesting an established trend without indicating whether it is upward or downward.
The first area to watch on the upside is the R1 pivot near $91. A daily close above this level could bring the R2 marker near $108 into view. On pullbacks, initial support sits near the classic pivot at $81, followed by the 200-day SMA at approximately $80. A sustained move below this level could shift attention towards the S2 area near $54 (TradingView, 28 July 2026).
This technical analysis is for informational purposes only and does not constitute financial advice or a recommendation to buy or sell any instrument.
Crude oil price history (2024–2026)
US Crude Oil (WTI)
The US Crude price closed at $75.38 on 29 July 2024 and spent much of that year and early 2025 trading in the $60–$79.99 range. Prices declined during spring 2025, with the contract reaching a two-year low near $55.76 on 4 May amid concerns about demand.
The market later recovered, rising above $70 by year-end and continuing higher in early 2026. US Crude reached $117.67 on 29 January 2026, its highest close during the period, before falling back into the $80–$89.99 range within days.
Prices continued to fluctuate during the first half of 2026, moving between the mid-$60s and low-$100s. US Crude closed at $79.99 on 28 July 2026, around 6.0% higher year to date but still well below its January peak.

Past performance is not a reliable indicator of future results. Prices are indicative and may differ from live market prices.
Brent Crude Oil
The Brent Crude price followed a broadly similar path, trading in the $60–$69.99 range through late 2024 before declining during 2025. The benchmark found support between the high $50s and low $60s during the winter of 2025–2026, then rose to $105.57 on 8 March 2026 before reversing much of the move.
A further rise took Brent to a two-year closing high of $109.26 on 5 May 2026, before prices eased during the summer. Brent Crude closed at $83.68 on 28 July 2026, around 37% higher than its level near $61 at the start of the year, but below its May peak.
Past performance is not a reliable indicator of future results. Prices are indicative and may differ from live market prices.
US Crude vs Brent Crude: Capital.com analyst outlook
US Crude and Brent Crude have moved through a broad range during 2026, with both benchmarks trading between the mid-$50s and levels above $100 per barrel. OPEC+ output decisions, Middle East shipping developments and changing demand estimates have pushed prices in different directions.
Some analysts view the gradual normalisation of tanker traffic through the Strait of Hormuz as a factor that could ease supply concerns and place downward pressure on prices. Others note that renewed disruption to shipping routes, or slower-than-expected OPEC+ supply increases, could support prices.
The spread of third-party forecasts for 2026 and 2027, from below $55 to above $90 per barrel, highlights the uncertainty surrounding the oil market. It does not indicate a consistent direction.
Some research houses cite slower global demand growth as a potential source of downward pressure. However, inventory drawdowns or unexpected supply outages could limit or offset this effect. Oil prices therefore remain sensitive to several interconnected variables, none of which offers a reliable signal in isolation.
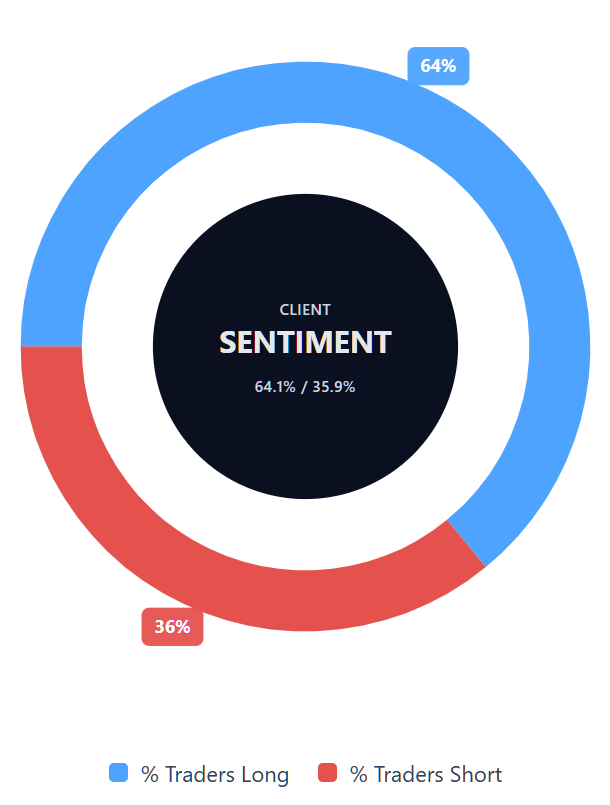
Capital.com’s client sentiment for US Crude CFDs
As of 28 July 2026, Capital.com client positioning in US Crude CFDs shows 64.1% of Capital.com clients with open positions in US Crude were long, compared with 35.9% who were short. This represents a difference of 28.2 percentage points between long and short positions.
Client sentiment reflects open positions on Capital.com and can change.
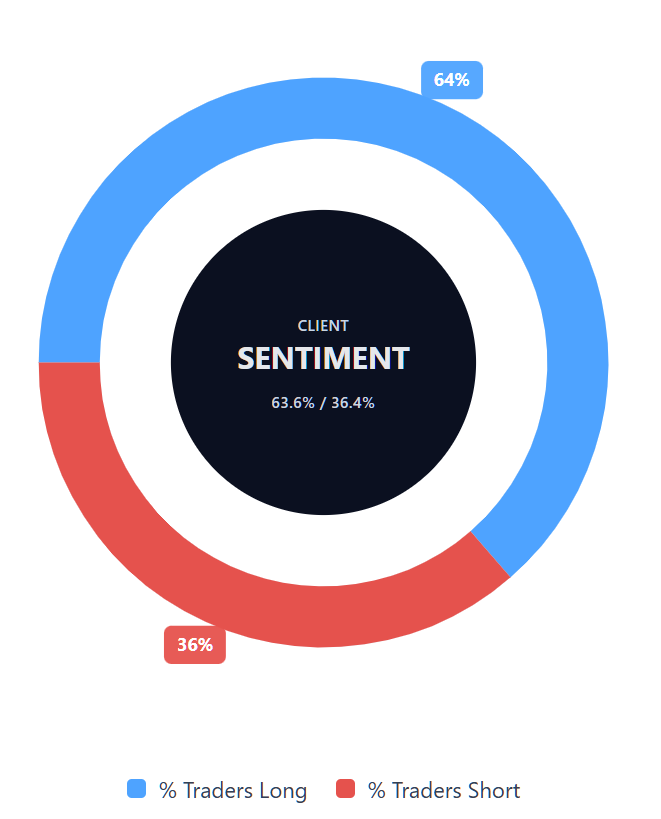
Capital.com’s client sentiment for Brent Crude CFDs
As of 28 July 2026, Capital.com client positioning in Brent Crude CFDs shows that 63.6% of Capital.com clients with open positions in Brent Crude were long, compared with 36.4% who were short. This represents a difference of 27.2 percentage points between long and short positions.
Client sentiment reflects open positions on Capital.com and can change.
Summary – US Crude and Brent Crude (2026)
- As of 9.50am UTC on 28 July 2026, US Crude traded near $79.90 and Brent Crude near $83.59, both within their wider 2026 trading ranges.
- US Crude has moved from the mid-$50s to above $100 per barrel during the year, while Brent has ranged from the high $50s to above $100.
- On TradingView, technical readings place both benchmarks around or below several key moving averages, while their RSI readings remain near neutral. Their ADX readings suggest established or moderately strong trends but do not indicate direction.
- The main factors influencing the outlook include OPEC+ output decisions, shipping conditions in the Strait of Hormuz and changes in global demand.
- Recent attention has focused on the pace of Gulf export normalisation following the reported US–Iran agreement, alongside changes to OPEC+ output quotas during the summer.
Past performance is not a reliable indicator of future results.
FAQ
What is the crude oil price forecast?
Could crude oil’s price go up or down?
Should I invest in crude oil?
Can I trade crude oil CFDs on Capital.com?
Yes, you can trade US Crude CFDs and Brent Crude CFDs on Capital.com. Trading commodity CFDs lets you speculate on price movements without owning the underlying asset and to take long or short positions. However, contracts for difference (CFDs) are traded on margin, and leverage amplifies both profits and losses. You should ensure you understand how CFD trading works, assess your risk tolerance, and recognise that losses can occur quickly.