
Gold forecast: Third-party price targets
Gold spot (XAU) traded at $4,582.82 at 9:44am UTC on 27 August 2026, after July core PCE inflation rose 3.3% year on year. Explore third-party Gold price targets and technical analysis. Past performance is not a reliable indicator of future results.
Gold (XAU/USD) is trading at $4,582.82 at 9:44am UTC on 27 August 2026, within the session’s $4,581.99–$4,672.61 intraday range. The price is near the lower end of that range after trading above $4,670 earlier in the session. Past performance is not a reliable indicator of future results.
Recent moves have coincided with a firmer US dollar after July inflation data showed core personal consumption expenditures rose 0.2% month on month and 3.3% year on year (BEA, 26 August 2026). US Treasury yield volatility also remains part of the broader backdrop (Investing.com, 26 August 2026).
Attention now turns to Federal Reserve Chair Kevin Warsh’s Jackson Hole remarks on 28 August as markets assess the implications for the US rate outlook (Federal Reserve, 27 August 2026).
Gold spot forecast: Jackson Hole, inflation and rates in focus
As of 27 August 2026, third-party gold predictions span different horizons, with interest rates, the US dollar, investment flows and central-bank demand recurring across their assumptions.
Citi (three-month and medium-term targets)
Citi’s forecast sets a three-month gold target of $4,500 per troy ounce, with a $5,000 base case over six to 12 months. The bank cites easing US front-end rates and recovering ETF flows, while noting that changing rate expectations and periods of price consolidation could alter the path (Investing.com, 14 August 2026).
Deutsche Bank (Q4 target)
Deutsche Bank maintains a $4,600 per troy ounce Q4 2026 target, alongside a model-derived year-end fair-value estimate of $4,700. Its assumptions include official-sector demand and broader macroeconomic conditions, while changes in central-bank buying or interest rates could alter the valuation framework (MarketWatch, 3 August 2026).
Wells Fargo (year-end target range)
Wells Fargo Investment Institute lowered its 2026 gold target to $4,900–$5,100 per troy ounce, while setting a 2027 range of $5,400–$5,600. The revision reflects higher US interest rates, a firmer dollar and slower central-bank buying, while future changes in those factors could alter the outlook (TheStreet, 18 August 2026).
Natixis (year-end forecast)
Natixis raised its year-end 2026 gold forecast to $5,000 per troy ounce from $4,600. The bank cites concerns around US debt and bond-market conditions, although changes in yields, the dollar or investor demand could affect the outcome (Kitco News, 25 August 2026).
UBS (12-month forecast)
UBS forecasts gold at $5,400 per troy ounce over the following 12 months. It cites renewed gold ETF inflows, central-bank purchases and potential US dollar weakness, while changes in Federal Reserve rate expectations could work against those assumptions (UBS, 25 August 2026).
Predictions and third-party forecasts are inherently uncertain, as they cannot fully account for unexpected market developments. Past performance is not a reliable indicator of future results.
Gold (XAU): latest and upcoming market developments
Gold spot (XAU) is trading at $4,582.82 at 9:44am UTC on 27 August 2026, within the session’s $4,581.99–$4,672.61 range. Recent price action has coincided with the release of July US inflation data. The Bureau of Economic Analysis said the July personal consumption expenditures price index rose 0.2% month on month and 3.7% year on year, while the core measure increased 3.3% annually (BEA, 26 August 2026). Higher inflation can support gold if it increases demand for perceived stores of value, but it can also weigh on prices if markets expect tighter monetary policy and higher yields.
Investment flows remain another factor. The World Gold Council reported $3 billion of net inflows into global gold-backed exchange-traded funds in July, reversing two months of outflows, while holdings rose by 23 tonnes to 4,068 tonnes (World Gold Council, 6 August 2026). Chinese gold ETFs also recorded positive flows in July, with inflows continuing through most trading days in early August (World Gold Council, 14 August 2026). Continued inflows could support demand, while renewed withdrawals could have the opposite effect.
Attention now turns to Kevin Warsh’s Jackson Hole remarks on 28 August (Federal Reserve, 27 August 2026). Upcoming releases include the August US employment report on 4 September and consumer price index data on 11 September, both of which may affect interest-rate and dollar expectations relevant to non-yielding gold (US Bureau of Labor Statistics, 18 February 2026).
Gold price: technical overview
Gold spot prices trades at $4,582.82 as of 9:44am UTC on 27 August 2026. The daily simple moving-average cluster sits at $4,389 / $4,199 / $4,376 / $4,527 across the 20/50/100/200-day periods, while the 20-day average remains above the 50-day average.
The 14-day relative strength index stands at 65.52, placing it within the 60–70 range. The average directional index at 37.31 indicates an established trend without identifying its direction. The 200-day exponential moving average sits lower at $4,312, more than 3% below its simple moving-average counterpart.
Gold is trading above the highest supplied classic resistance pivot, R3 at $4,558. A daily close remaining above that level could keep price above the supplied classic resistance references, while the Hull moving average at $4,662 provides a nearer technical marker.
On the downside, the classic pivot at $4,071 provides the main supplied pivot reference. The closer long-term moving-average shelf sits at $4,527 on the 200-day simple moving average, while a move below that area could bring the $4,376 100-day average back into focus (TradingView, 27 August 2026).
This is technical analysis for informational purposes only and does not constitute financial advice or a recommendation to buy or sell any instrument.
Gold price history (2024–2026)
The gold spot price started the two-year period at $2,508.35 on 28 August 2024 and ended that year at $2,624.69, a gain of around 4.6%.
The move accelerated through 2025. Gold rose above $3,000 in March and $4,000 in October before closing the year at $4,319.14. The rise coincided with continued central-bank demand and periods of economic and geopolitical uncertainty. Central banks bought a net 863 tonnes during 2025, although purchases were lower than in the previous three years (World Gold Council, 29 January 2026).
Price swings widened in early 2026. Gold reached a two-year intraday high of $5,598.39 on 28 January before falling below $4,500 in March, then recovering above $4,800 in April. Geopolitical uncertainty, concerns around US debt and movements in the dollar remained part of the broader backdrop during the year.
Gold trades at $4,582.82 as of 9:44am UTC on 27 August 2026, around 6.1% above its 2025 year-end close and 82.7% above its 28 August 2024 close.

Past performance is not a reliable indicator of future results. Prices are indicative and may differ from live market prices.
Gold price outlook: Capital.com analysis
Gold spot’s 2026 performance has combined higher overall prices with wide swings, with XAU trading at $4,582.82 at 9:44am UTC on 27 August. The World Gold Council has highlighted elevated volatility and large price swings during 2026 (World Gold Council, 1 July 2026). Demand from gold-backed exchange-traded funds has remained relevant, with global funds recording $3 billion of net inflows in July (World Gold Council, 6 August 2026). Continued inflows could support gold prices, while renewed withdrawals could work in the opposite direction, particularly if investors favour higher-yielding assets (World Gold Council, 6 August 2026).
US inflation and monetary policy add another layer. July’s personal consumption expenditures price index rose 3.7% year on year, with the core measure up 3.3% (BEA, 26 August 2026). Persistent inflation can support demand for gold as a perceived store of value, but it can also weigh on prices if markets expect tighter Federal Reserve policy, higher yields or a firmer US dollar. Kevin Warsh’s Jackson Hole remarks are scheduled for 28 August and may influence those expectations as markets reassess the interest-rate outlook (Federal Reserve, 27 August 2026).
Capital.com’s client sentiment for Gold CFDs
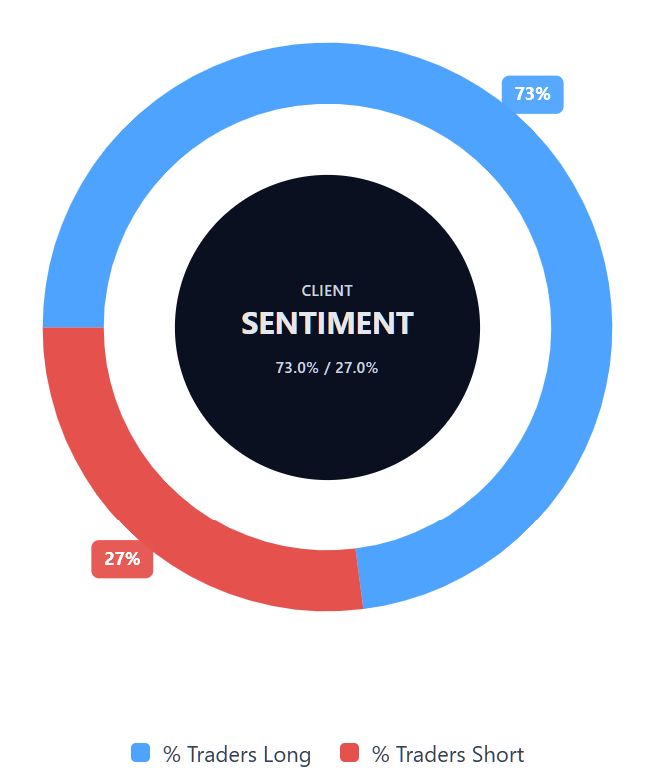
As of 27 August 2026, Capital.com client positioning in Gold spot CFDs is 73% buyers versus 27% sellers, putting buyers ahead by 46 percentage points and meaning buyer positions represent the majority of this snapshot. This snapshot reflects open positions on Capital.com and can change.
Summary – Gold price 2026
- Gold spot trades at $4,582.82 at 9:44am UTC on 27 August 2026, around 82.7% above its 28 August 2024 close.
- Technical indicators on TradingView place the relative strength index at 65.52, while price remains above the supplied 100- and 200-day simple moving averages.
- Key drivers include US inflation, Federal Reserve policy, Treasury yields, the US dollar, ETF flows and central-bank gold demand.
- Recent attention centres on July ETF inflows, US inflation data and Kevin Warsh’s Jackson Hole remarks, alongside upcoming US jobs and CPI data.
Past performance is not a reliable indicator of future results.
FAQ
What is the Gold price forecast?
Third-party forecasts in this article range from $4,500 per troy ounce over three months to $5,400 over 12 months. Citi, Deutsche Bank, Wells Fargo, Natixis and UBS base their outlooks on factors including US interest rates, the dollar, ETF flows and central-bank demand. These assumptions can change as economic and market conditions develop, so forecasts shouldn’t be treated as reliable indicators of future prices.
Could Gold’s price go up or down?
Yes. Gold can move in either direction as macroeconomic and market conditions change. Lower interest rates, a weaker US dollar, continued ETF inflows or stronger central-bank demand could support prices. Higher yields, a firmer dollar or ETF outflows could weigh on gold instead. Inflation and geopolitical uncertainty can also influence demand, although their effects aren’t consistent and may depend on how investors interpret the wider economic backdrop.
Should I invest in Gold?
Whether gold is appropriate depends on individual circumstances, objectives and tolerance for risk, so this article doesn’t provide investment advice. Gold has risen substantially over the two-year period covered here, but its 2026 trading history also includes wide price swings. Investors considering gold exposure should weigh factors such as market volatility, interest rates and currency movements, while CFD traders face additional risks because leverage can magnify both gains and losses.
Can I trade Gold spot CFDs on Capital.com?
Yes, you can trade Gold CFDs on Capital.com. Trading commodity CFDs lets you speculate on price movements without owning the underlying asset and to take long or short positions. However, contracts for difference (CFDs) are traded on margin, and leverage amplifies both profits and losses. You should ensure you understand how CFD trading works, assess your risk tolerance, and recognise that losses can occur quickly.