Gold price forecast: Central bank buying supports demand
Gold spot is shaped by central bank buying, geopolitical risk and US dollar moves, with each factor influencing demand and near-term price expectations. Explore third-party Gold price targets and technical analysis. Past performance is not a reliable indicator of future results.
Gold (XAU/USD) is trading at $4,529.54 as of 9:47am UTC on 2 June 2026, within an intraday range of $4,458.45–$4,544.14. Past performance is not a reliable indicator of future results.
Support comes amid continued central bank accumulation, with the World Gold Council reporting that central banks globally purchased 863 tonnes of gold in 2025, remaining above the 2010–2021 annual average of 473 tonnes and well above pre-2022 norms (World Gold Council, 29 January 2026). The metal has also drawn safe-haven interest following heightened geopolitical tensions; US and Israeli forces launched joint strikes on Iran on 28 February 2026 in what the US designated Operation Epic Fury, a conflict that continued through early May and has kept the region in focus (Britannica, 1 June 2026). Meanwhile, a softer US dollar has reduced the relative cost of gold for holders of non-dollar currencies, providing further price support, with gold up approximately 34% year-on-year as of 2 June 2026 (Trading Economics, 31 May 2026).
Gold: third-party targets weigh demand against rate risks
As of 2 June 2026, third-party gold predictions show a split between trimmed near-term averages and high year-end targets. Softer investor demand, elevated US real yields and continued central bank accumulation remain the main factors shaping those views.
J.P. Morgan (average forecast revision)
J.P. Morgan lowered its 2026 annual average gold price forecast to $5,243/oz from $5,708/oz, while maintaining its base-case year-end target of around $6,000/oz. The bank cited an expected re-acceleration in demand through the second half of the year. It noted that investor client interest had 'dried to a trickle', with activity and demand metrics described as stagnant in the near term. However, it also pointed to resumed central bank and ETF inflows as the mechanism it expects to lift prices towards its year-end level (Sahm Capital, 18 May 2026).
Reuters (broker round-up)
Reuters reported that major brokerages remained broadly bullish on gold despite near-term demand softness, noting J.P. Morgan's revised average alongside maintained high year-end targets across the street. The newswire said softer near-term investor engagement had not prompted banks to abandon directional year-end calls, with targets across covered institutions spanning $5,400/oz–$6,300/oz at the time of publication (Reuters, 18 May 2026).
Yahoo Finance (consensus tracker)
Yahoo Finance reported that J.P. Morgan's revised average of $5,243/oz compared with consensus estimates sitting closer to $4,900–$5,000/oz from more cautious forecasters. It also noted the bank's maintained year-end call of around $6,000/oz as one of the more bullish directional targets on the street. The report attributed the gap between annual averages and year-end targets to front-loaded price weakness in 2026 dragging down full-year averages, even as second-half recovery expectations kept terminal-level forecasts elevated (Yahoo Finance, 22 May 2026).
Reuters (market report)
Reuters reported that spot gold fell to a two-month low of $4,447.71/oz on 27 May 2026, as expectations of tighter monetary policy linked to war-driven inflation weighed on prices. US gold futures for June delivery settled 1.2% lower at $4,448.40/oz. The report noted that the Middle East conflict remained the dominant market influence, with traders citing the trajectory of US-Iran talks and the Federal Reserve's response to inflationary pressures from the conflict as key variables weighing on near-term sentiment (Reuters, 27 May 2026).
Yahoo Finance (multi-bank outlook)
Yahoo Finance summarised the broad institutional outlook as 'cautiously bullish', noting that while a move to $6,000/oz in 2026 remained plausible under some bank scenarios, delivery would depend on macroeconomic conditions aligning with base-case assumptions. The tracker noted a consensus cluster near $4,700–$5,000/oz for the cautious end of the spectrum, against high-end bank targets of $6,000–$6,300/oz. The spread reflects differing assumptions on the pace of Federal Reserve easing and the sustainability of central bank gold buying (Yahoo Finance, 26 May 2026).
Predictions and third-party forecasts are inherently uncertain, as they cannot fully account for unexpected market developments. Past performance is not a reliable indicator of future results.
Gold spot: key macro data in focus
As of 2 June 2026, gold spot (XAU) traders are monitoring a cluster of US macro releases with direct implications for Federal Reserve rate expectations and, by extension, gold's near-term pricing. The US ISM Manufacturing PMI was due on 2 June, with markets watching for signs of demand deterioration linked to the ongoing Middle East conflict and its inflationary pass-through into input costs (Trading Economics, 2 June 2026).
The Federal Reserve's rate path remains a central variable, with policymakers cited in late May as factoring war-driven inflation into their deliberations. Reuters reported on 27 May 2026 that expectations of tighter-for-longer monetary policy had pushed gold to a two-month low of $4,447.71/oz, as rising US real yields compressed the appeal of the non-yielding metal (Reuters, 27 May 2026). The US Non-Farm Payrolls report, scheduled for release on 6 June 2026, is the next major data point, with a stronger-than-expected print potentially reinforcing the case for delayed Federal Reserve easing and weighing further on near-term gold sentiment (MarketWatch, 31 May 2026).
Geopolitical developments continue to run alongside the data calendar as a parallel driver. The trajectory of US-Iran talks, flagged by Reuters as the 'biggest influence' on gold markets in late May, may amplify or offset macro signals depending on whether diplomatic progress materialises in the days ahead (Reuters, 27 May 2026).
Gold price: technical overview
Gold spot prices trade at $4,529.54 as of 9:47am UTC on 2 June 2026, sitting below its short- and medium-term moving average cluster. The daily 20/50/100/200-SMAs are running at approximately $4,583, $4,631, $4,802 and $4,412, with price caught between the 200-SMA acting as a floor and the 20-SMA capping recovery attempts overhead, according to TradingView data. The 200-day exponential moving average (EMA) sits closer at around $4,380, providing a secondary reference below the 200-SMA. The Hull moving average (9) at around $4,507 sits marginally below current price, suggesting very short-term momentum has begun to stabilise.
The 14-day relative strength index registers 45.70, placing momentum in lower-neutral territory – neither oversold nor showing meaningful recovery conviction (TradingView). The average directional index at 24.80 is approaching the threshold that typically reflects an established trend, indicating the current directional move carries moderate strength.
On the classic pivot framework, the pivot point at $4,560 represents the nearest overhead reference; a daily close above there could put R1 at around $4,754 into view. To the downside, S1 sits at around $4,347, with the 200-SMA near $4,412 and the 200-day EMA near $4,380 forming the nearest moving-average shelf between current price and that level (TradingView, 2 June 2026).
This is technical analysis for informational purposes only and does not constitute financial advice or a recommendation to buy or sell any instrument.
Gold price history (2024–2026)
The gold spot price opened June 2024 trading in the $2,290–$2,390 range, drifting sideways through summer before a steady uptrend took hold in autumn. By late December 2024, prices had climbed to close the year at around $2,625/oz, extending a multi-year rally driven by central bank accumulation and haven demand.
2025 brought a more decisive move higher. Prices moved through the $2,600s and $2,900s before breaching $3,000 for the first time, then accelerating through $4,000 by December 2025 amid sustained US dollar weakness and geopolitical uncertainty.
The sharpest move came in January 2026. Gold rose to an intraday all-time high above $5,414/oz on 27 January, before falling by nearly 10% in the days after the announcement of Kevin Warsh as prospective Federal Reserve chair, which unsettled precious metals markets. From that peak, prices oscillated between roughly $4,900 and $5,238 through February and early March, before a deeper pullback sent XAU below $4,500 by mid-March.
Gold spot (XAU) closed at $4,529.74 on 2 June 2026, approximately 16.6% below the January all-time high but around 72.5% above its level on 2 June 2024.
Past performance is not a reliable indicator of future results. Prices are indicative and may differ from live market prices.
Gold price outlook: Capital.com analysis
Gold spot's price trajectory over the past two years reflects a market navigating competing forces and considerable volatility. The metal rose to an all-time high above $5,414/oz in January 2026, supported by a weaker US dollar, accelerating central bank accumulation and rising haven demand; the World Gold Council reported net central bank purchases of 244 tonnes in Q1 2026 alone. Since then, gold has pulled back sharply, with Morgan Stanley noting that elevated US real yields and the inflationary impact of the Middle East conflict have made monetary policy sensitivity the dominant price driver, temporarily overshadowing gold's traditional safe-haven role.
Trading near $4,529.54 as of 2 June 2026, gold remains approximately 35% higher year-on-year, supported by structural demand from central banks and ETF re-accumulation. The bull case rests on a softer dollar, resumed institutional inflows and persistent geopolitical risk. The bear case centres on tighter-for-longer Federal Reserve policy, which tends to strengthen the dollar and raise the opportunity cost of holding a non-yielding asset. Both dynamics remain active, reflecting the range of views currently present across institutional forecasts.
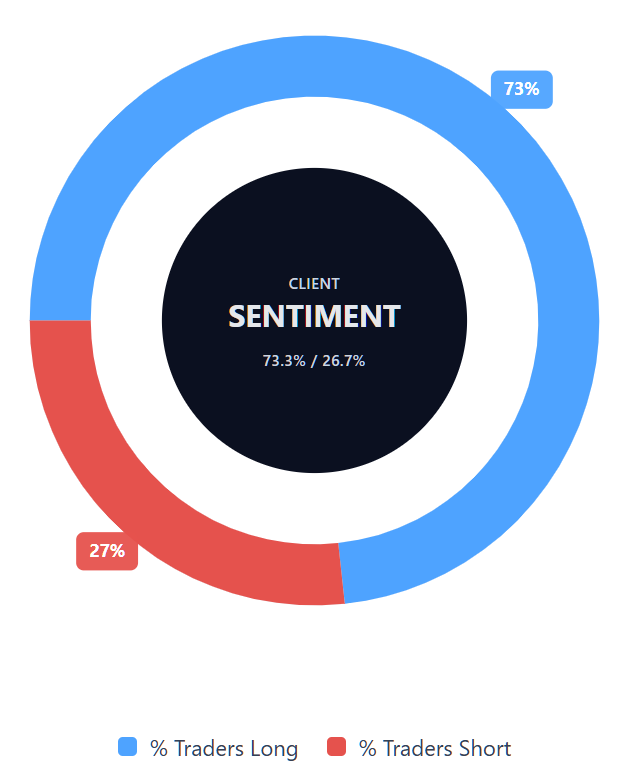
Capital.com’s client sentiment for Gold CFDs
As of 2 June 2026, Capital.com client positioning in Gold spot CFDs shows 73.3% buyers versus 26.7% sellers, putting buyers ahead by 46.6 percentage points and placing sentiment in one-sided, long-leaning territory. This snapshot reflects open positions on Capital.com and can change.
Summary – Gold price 2026
- Gold spot (XAU) trades at $4,529.54 as of 9:47am UTC on 2 June 2026, around 72.5% above its June 2024 level near $2,625/oz.
- Key structural drivers include persistent central bank buying, with the World Gold Council reporting 244 tonnes of net purchases in Q1 2026, and ongoing haven demand.
- A softer US dollar supports gold's appeal for non-dollar buyers, though elevated US real yields and tighter-for-longer Federal Reserve policy present a countervailing headwind.
- Middle East geopolitical risk, including US-Iran tensions, has been cited by Reuters as the dominant near-term market influence as of late May 2026.
Past performance is not a reliable indicator of future results.
FAQ
What is the gold price forecast?
Could gold’s price go up or down?
Should I invest in gold?
Can I trade gold CFDs on Capital.com?
Yes, you can trade Gold CFDs on Capital.com. Trading commodity CFDs lets you speculate on price movements without owning the underlying asset and to take long or short positions. However, contracts for difference (CFDs) are traded on margin, and leverage amplifies both profits and losses. You should ensure you understand how CFD trading works, assess your risk tolerance, and recognise that losses can occur quickly.